XM Radio 2015 Annual Report Download - page 83
Download and view the complete annual report
Please find page 83 of the 2015 XM Radio annual report below. You can navigate through the pages in the report by either clicking on the pages listed below, or by using the keyword search tool below to find specific information within the annual report.-
 1
1 -
2
-
3
-
4
-
5
-
6
-
7
-
8
-
9
-
10
-
11
-
12
-
13
-
14
-
15
-
16
-
17
-
18
-
19
-
20
-
21
-
22
-
23
-
24
-
25
-
26
-
27
-
28
-
29
-
30
-
31
-
32
-
33
-
34
-
35
-
36
-
37
-
38
-
39
-
40
-
41
-
42
-
43
-
44
-
45
-
46
-
47
-
48
-
49
-
50
-
51
-
52
-
53
-
54
-
55
-
56
-
57
-
58
-
59
-
60
-
61
-
62
-
63
-
64
-
65
-
66
-
67
-
68
-
69
-
70
-
71
-
72
-
 73
73 -
 74
74 -
 75
75 -
 76
76 -
 77
77 -
 78
78 -
 79
79 -
 80
80 -
 81
81 -
 82
82 -
 83
83 -
 84
84 -
 85
85 -
 86
86 -
 87
87 -
 88
88 -
 89
89 -
 90
90 -
 91
91 -
 92
92 -
 93
93 -
94
-
95
-
96
-
97
-
98
-
99
-
100
-
101
-
102
-
103
-
104
-
105
-
106
-
107
-
108
-
109
-
110
-
111
-
112
-
113
-
114
-
115
-
116
-
117
-
118
-
119
-
120
-
121
-
122
-
123
-
124
-
125
-
126
-
127
-
128
-
129
-
130
-
131
-
132
 |
 |

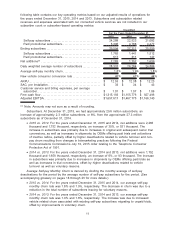
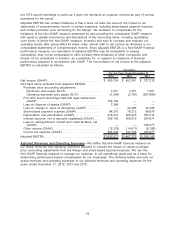
pre-1972 sound recordings is useful as it does not represent an expense incurred as part of normal
operations for the period.
Adjusted EBITDA has certain limitations in that it does not take into account the impact to our
statements of comprehensive income of certain expenses, including share-based payment expense
and certain purchase price accounting for the Merger. We endeavor to compensate for the
limitations of the Non-GAAP measure presented by also providing the comparable GAAP measure
with equal or greater prominence and descriptions of the reconciling items, including quantifying
such items, to derive the Non-GAAP measure. Investors that wish to compare and evaluate our
operating results after giving effect for these costs, should refer to net income as disclosed in our
consolidated statements of comprehensive income. Since adjusted EBITDA is a Non-GAAP financial
performance measure, our calculation of adjusted EBITDA may be susceptible to varying
calculations; may not be comparable to other similarly titled measures of other companies; and
should not be considered in isolation, as a substitute for, or superior to measures of financial
performance prepared in accordance with GAAP. The reconciliation of net income to the adjusted
EBITDA is calculated as follows:
2015 2014 2013
For the Years Ended December 31,
Unaudited
Net income (GAAP): . . . . . . . . . . . . . . . . . . . . . . . . . . . . . . . . . . . . . . $ 509,724 $ 493,241 $ 377,215
Add back items excluded from Adjusted EBITDA:
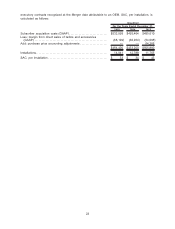
Purchase price accounting adjustments:
Revenues (see pages 20-21) . . . . . . . . . . . . . . . . . . . . . . . . . 7,251 7,251 7,251
Operating expenses (see pages 20-21). . . . . . . . . . . . . . . . (1,394) (3,781) (207,854)
Pre-1972 sound recordings historical legal settlements
(GAAP) . . . . . . . . . . . . . . . . . . . . . . . . . . . . . . . . . . . . . . . . . . . . . . 109,164 — —
Loss on disposal of assets (GAAP) . . . . . . . . . . . . . . . . . . . . . 7,384 — —
Loss on change in value of derivatives (GAAP) . . . . . . . . . . — 34,485 20,393
Share-based payment expense (GAAP) . . . . . . . . . . . . . . . . . 84,310 78,212 68,876
Depreciation and amortization (GAAP). . . . . . . . . . . . . . . . . . . 272,214 266,423 253,314
Interest expense, net of amounts capitalized (GAAP). . . . . 299,103 269,010 204,671
Loss on extinguishment of debt and credit facilities, net
(GAAP) . . . . . . . . . . . . . . . . . . . . . . . . . . . . . . . . . . . . . . . . . . . . . . — — 190,577
Other income (GAAP) . . . . . . . . . . . . . . . . . . . . . . . . . . . . . . . . . . (12,379) (14,611) (8,180)
Income tax expense (GAAP) . . . . . . . . . . . . . . . . . . . . . . . . . . . . 382,240 337,545 259,877
Adjusted EBITDA . . . . . . . . . . . . . . . . . . . . . . . . . . . . . . . . . . . . . . . . . $1,657,617 $1,467,775 $1,166,140
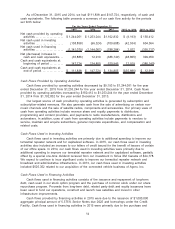
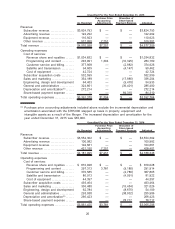
Adjusted Revenues and Operating Expenses—We define this Non-GAAP financial measure as
our actual revenues and operating expenses adjusted to exclude the impact of certain purchase
price accounting adjustments from the Merger and share-based payment expense. We use this
Non-GAAP financial measure to manage our business, to set operational goals and as a basis for
determining performance-based compensation for our employees. The following tables reconcile our
actual revenues and operating expenses to our adjusted revenues and operating expenses for the
years ended December 31, 2015, 2014 and 2013:
19