XM Radio 2015 Annual Report Download - page 125
Download and view the complete annual report
Please find page 125 of the 2015 XM Radio annual report below. You can navigate through the pages in the report by either clicking on the pages listed below, or by using the keyword search tool below to find specific information within the annual report.
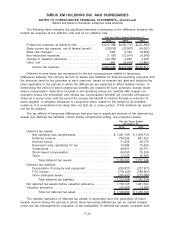
The following table indicates the significant elements contributing to the difference between the
federal tax expense at the statutory rate and at our effective rate:
2015 2014 2013
For the Years Ended December 31,
Federal tax expense, at statutory rate . . . . . . . . . . . . . . . . $(312,188) $(290,775) $(222,982)
State income tax expense, net of federal benefit. . . . . . (26,018) (32,067) (19,031)
State rate changes . . . . . . . . . . . . . . . . . . . . . . . . . . . . . . . . . . 608 5,334 (8,666)
Non-deductible expenses . . . . . . . . . . . . . . . . . . . . . . . . . . . . (1,106) (13,914) (9,545)
Change in valuation allowance . . . . . . . . . . . . . . . . . . . . . . . (44,100) 2,836 4,228
Other, net . . . . . . . . . . . . . . . . . . . . . . . . . . . . . . . . . . . . . . . . . . 564 (8,959) (3,881)
Income tax expense . . . . . . . . . . . . . . . . . . . . . . . . . . . . $(382,240) $(337,545) $(259,877)
Deferred income taxes are recognized for the tax consequences related to temporary
differences between the carrying amount of assets and liabilities for financial reporting purposes and
the amounts used for tax purposes at each year-end, based on enacted tax laws and statutory tax
rates applicable to the periods in which the differences are expected to affect taxable income. In
determining the period in which related tax benefits are realized for book purposes, excess share-
based compensation deductions included in net operating losses are realized after regular net
operating losses are exhausted; and excess tax compensation benefits are recorded off balance-
sheet as a memo entry until the period the excess tax benefit is realized through a reduction of
taxes payable. A valuation allowance is recognized when, based on the weight of all available
evidence, it is considered more likely than not that all, or some portion, of the deferred tax assets
will not be realized.
The tax effects of temporary differences that give rise to significant portions of the deferred tax
assets and deferred tax liabilities, shown before jurisdictional netting, are presented below:
2015 2014
For the Years Ended
December 31,
Deferred tax assets:
Net operating loss carryforwards . . . . . . . . . . . . . . . . . . . . . . . . . $ 1,447,159 $ 1,818,719
Deferred revenue . . . . . . . . . . . . . . . . . . . . . . . . . . . . . . . . . . . . . . . . 730,239 691,323
Accrued bonus . . . . . . . . . . . . . . . . . . . . . . . . . . . . . . . . . . . . . . . . . . 31,458 28,170
Expensed costs capitalized for tax . . . . . . . . . . . . . . . . . . . . . . . 19,584 19,624
Investments . . . . . . . . . . . . . . . . . . . . . . . . . . . . . . . . . . . . . . . . . . . . . 46,857 46,751
Stock based compensation. . . . . . . . . . . . . . . . . . . . . . . . . . . . . . . 66,030 79,296
Other . . . . . . . . . . . . . . . . . . . . . . . . . . . . . . . . . . . . . . . . . . . . . . . . . . . 37,226 38,365
Total deferred tax assets . . . . . . . . . . . . . . . . . . . . . . . . . . . . 2,378,553 2,722,248
Deferred tax liabilities:
Depreciation of property and equipment . . . . . . . . . . . . . . . . . . (250,821) (237,971)
FCC license. . . . . . . . . . . . . . . . . . . . . . . . . . . . . . . . . . . . . . . . . . . . . (779,145) (789,857)
Other intangible assets . . . . . . . . . . . . . . . . . . . . . . . . . . . . . . . . . . (190,442) (213,086)
Total deferred tax liabilities . . . . . . . . . . . . . . . . . . . . . . . . . . (1,220,408) (1,240,914)
Net deferred tax assets before valuation allowance. . . . . . . . . . . . 1,158,145 1,481,334
Valuation allowance. . . . . . . . . . . . . . . . . . . . . . . . . . . . . . . . . . . . . . . . . . (49,095) (4,995)
Total net deferred tax asset . . . . . . . . . . . . . . . . . . . . . . . . . $ 1,109,050 $ 1,476,339
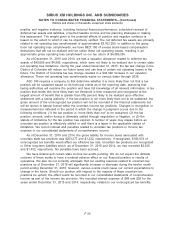
The ultimate realization of deferred tax assets is dependent upon the generation of future
taxable income during the periods in which those temporary differences can be carried forward
under tax law. Management’s evaluation of the realizability of deferred tax assets considers both
F-34
SIRIUS XM HOLDINGS INC. AND SUBSIDIARIES
NOTES TO CONSOLIDATED FINANCIAL STATEMENTS—(Continued)
(Dollars and shares in thousands, except per share amounts)


