XM Radio 2015 Annual Report Download - page 75
Download and view the complete annual report
Please find page 75 of the 2015 XM Radio annual report below. You can navigate through the pages in the report by either clicking on the pages listed below, or by using the keyword search tool below to find specific information within the annual report.-
 1
1 -
2
-
3
-
4
-
5
-
6
-
7
-
8
-
9
-
10
-
11
-
12
-
13
-
14
-
15
-
16
-
17
-
18
-
19
-
20
-
21
-
22
-
23
-
24
-
25
-
26
-
27
-
28
-
29
-
30
-
31
-
32
-
33
-
34
-
35
-
36
-
37
-
38
-
39
-
40
-
41
-
42
-
43
-
44
-
45
-
46
-
47
-
48
-
49
-
50
-
51
-
52
-
53
-
54
-
55
-
56
-
57
-
58
-
59
-
60
-
61
-
62
-
63
-
64
-
 65
65 -
 66
66 -
 67
67 -
 68
68 -
 69
69 -
 70
70 -
 71
71 -
 72
72 -
 73
73 -
 74
74 -
 75
75 -
 76
76 -
 77
77 -
 78
78 -
 79
79 -
 80
80 -
 81
81 -
 82
82 -
 83
83 -
 84
84 -
 85
85 -
86
-
87
-
88
-
89
-
90
-
91
-
92
-
93
-
94
-
95
-
96
-
97
-
98
-
99
-
100
-
101
-
102
-
103
-
104
-
105
-
106
-
107
-
108
-
109
-
110
-
111
-
112
-
113
-
114
-
115
-
116
-
117
-
118
-
119
-
120
-
121
-
122
-
123
-
124
-
125
-
126
-
127
-
128
-
129
-
130
-
131
-
132
 |
 |

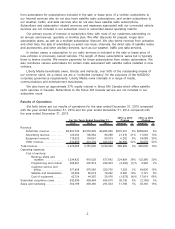
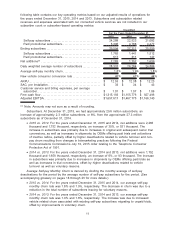
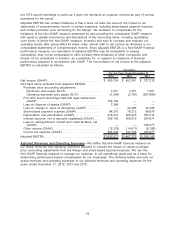
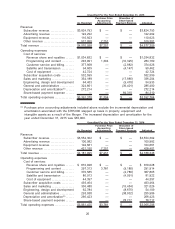
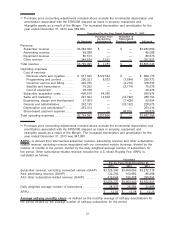
following table contains our key operating metrics based on our adjusted results of operations for
the years ended December 31, 2015, 2014 and 2013. Subscribers and subscription related
revenues and expenses associated with our connected vehicle services are not included in our
subscriber count or subscriber-based operating metrics:
2015 2014 2013
For the Years Ended December 31,
Unaudited
Self-pay subscribers . . . . . . . . . . . . . . . . . . . . . . . . . . . . . . . . . . . . 24,288 22,523 21,082
Paid promotional subscribers. . . . . . . . . . . . . . . . . . . . . . . . . . . . 5,306 4,788 4,477
Ending subscribers . . . . . . . . . . . . . . . . . . . . . . . . . . . . . . . . . . . . . . . 29,594 27,311 25,559
Self-pay subscribers . . . . . . . . . . . . . . . . . . . . . . . . . . . . . . . . . . . . 1,765 1,441 1,512
Paid promotional subscribers. . . . . . . . . . . . . . . . . . . . . . . . . . . . 517 311 147
Net additions(a) . . . . . . . . . . . . . . . . . . . . . . . . . . . . . . . . . . . . . . . . . . . 2,283 1,752 1,659
Daily weighted average number of subscribers . . . . . . . . . . . . . 28,337 26,284 24,886
Average self-pay monthly churn . . . . . . . . . . . . . . . . . . . . . . . . . . . 1.8% 1.9% 1.8%
New vehicle consumer conversion rate . . . . . . . . . . . . . . . . . . . . 40% 41% 44%
ARPU. . . . . . . . . . . . . . . . . . . . . . . . . . . . . . . . . . . . . . . . . . . . . . . . . . . . $ 12.53 $ 12.38 $ 12.23
SAC, per installation . . . . . . . . . . . . . . . . . . . . . . . . . . . . . . . . . . . . . . $ 33 $ 34 $ 43
Customer service and billing expenses, per average
subscriber. . . . . . . . . . . . . . . . . . . . . . . . . . . . . . . . . . . . . . . . . . . . . . $ 1.01 $ 1.07 $ 1.06
Free cash flow . . . . . . . . . . . . . . . . . . . . . . . . . . . . . . . . . . . . . . . . . . . $1,315,193 $1,155,776 $ 927,496
Adjusted EBITDA . . . . . . . . . . . . . . . . . . . . . . . . . . . . . . . . . . . . . . . . . $1,657,617 $1,467,775 $1,166,140
(a) Note: Amounts may not sum as a result of rounding.
Subscribers. At December 31, 2015, we had approximately 29.6 million subscribers, an
increase of approximately 2.3 million subscribers, or 8%, from the approximate 27.3 million
subscribers as of December 31, 2014.
•2015 vs. 2014: For the years ended December 31, 2015 and 2014, net additions were 2,283
thousand and 1,752 thousand, respectively, an increase of 30%, or 531 thousand. The
increase in subscribers was primarily due to increases in original and subsequent owner trial
conversions, as well as increases in shipments by OEMs offering paid trials and activations
of inactive radios, partially offset by higher deactivations related to vehicle turnover and non-
pay churn resulting from changes in telemarketing practices following the Federal
Communications Commission’s July 10, 2015 order relating to the Telephone Consumer
Protection Act of 1991.
•2014 vs. 2013: For the years ended December 31, 2014 and 2013, net additions were 1,752
thousand and 1,659 thousand, respectively, an increase of 6%, or 93 thousand. The increase
in subscribers was primarily due to increases in shipments by OEMs offering paid trials as
well as increases in trial conversions, offset by higher deactivations related to vehicle
turnover as well as voluntary reasons.
Average Self-pay Monthly Churn is derived by dividing the monthly average of self-pay
deactivations for the period by the average number of self-pay subscribers for the period. (See
accompanying glossary on pages 18 through 23 for more details.)
•2015 vs. 2014: For the years ended December 31, 2015 and 2014, our average self-pay
monthly churn rate was 1.8% and 1.9%, respectively. The decrease in churn was due to a
reduction in the total number of subscribers leaving for voluntary reasons.
•2014 vs. 2013: For the years ended December 31, 2014 and 2013, our average self-pay
monthly churn rate was 1.9% and 1.8%, respectively. The increase was due to increased
vehicle related churn associated with existing self-pay subscribers migrating to unpaid trials,
offset by improvements in voluntary churn.
11