XM Radio 2015 Annual Report Download - page 95
Download and view the complete annual report
Please find page 95 of the 2015 XM Radio annual report below. You can navigate through the pages in the report by either clicking on the pages listed below, or by using the keyword search tool below to find specific information within the annual report.-
 1
1 -
2
-
3
-
4
-
5
-
6
-
7
-
8
-
9
-
10
-
11
-
12
-
13
-
14
-
15
-
16
-
17
-
18
-
19
-
20
-
21
-
22
-
23
-
24
-
25
-
26
-
27
-
28
-
29
-
30
-
31
-
32
-
33
-
34
-
35
-
36
-
37
-
38
-
39
-
40
-
41
-
42
-
43
-
44
-
45
-
46
-
47
-
48
-
49
-
50
-
51
-
52
-
53
-
54
-
55
-
56
-
57
-
58
-
59
-
60
-
61
-
62
-
63
-
64
-
65
-
66
-
67
-
68
-
69
-
70
-
71
-
72
-
73
-
74
-
75
-
76
-
77
-
78
-
79
-
80
-
81
-
82
-
83
-
84
-
 85
85 -
 86
86 -
 87
87 -
 88
88 -
 89
89 -
 90
90 -
 91
91 -
 92
92 -
 93
93 -
 94
94 -
 95
95 -
 96
96 -
 97
97 -
 98
98 -
 99
99 -
 100
100 -
 101
101 -
 102
102 -
 103
103 -
 104
104 -
 105
105 -
106
-
107
-
108
-
109
-
110
-
111
-
112
-
113
-
114
-
115
-
116
-
117
-
118
-
119
-
120
-
121
-
122
-
123
-
124
-
125
-
126
-
127
-
128
-
129
-
130
-
131
-
132
 |
 |

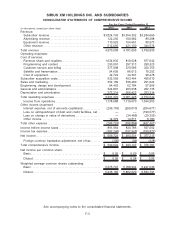
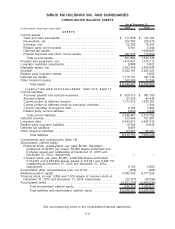
SIRIUS XM HOLDINGS INC. AND SUBSIDIARIES
CONSOLIDATED BALANCE SHEETS
(in thousands, except per share data) 2015 2014
As of December 31,
ASSETS
Current assets:
Cash and cash equivalents . . . . . . . . . . . . . . . . . . . . . . . . . . . . . . . . . . . . . . . . . $ 111,838 $ 147,724
Receivables, net . . . . . . . . . . . . . . . . . . . . . . . . . . . . . . . . . . . . . . . . . . . . . . . . . . . 234,782 220,579
Inventory, net . . . . . . . . . . . . . . . . . . . . . . . . . . . . . . . . . . . . . . . . . . . . . . . . . . . . . . 22,295 19,397
Related party current assets . . . . . . . . . . . . . . . . . . . . . . . . . . . . . . . . . . . . . . . . 5,941 4,344
Deferred tax assets . . . . . . . . . . . . . . . . . . . . . . . . . . . . . . . . . . . . . . . . . . . . . . . . — 1,038,603
Prepaid expenses and other current assets . . . . . . . . . . . . . . . . . . . . . . . . . 187,033 119,099
Total current assets . . . . . . . . . . . . . . . . . . . . . . . . . . . . . . . . . . . . . . . . . . . . . . 561,889 1,549,746
Property and equipment, net. . . . . . . . . . . . . . . . . . . . . . . . . . . . . . . . . . . . . . . . . . 1,415,401 1,510,112
Long-term restricted investments . . . . . . . . . . . . . . . . . . . . . . . . . . . . . . . . . . . . . . 9,888 5,922
Intangible assets, net. . . . . . . . . . . . . . . . . . . . . . . . . . . . . . . . . . . . . . . . . . . . . . . . . 2,593,346 2,645,046
Goodwill . . . . . . . . . . . . . . . . . . . . . . . . . . . . . . . . . . . . . . . . . . . . . . . . . . . . . . . . . . . . . 2,205,107 2,205,107
Related party long-term assets. . . . . . . . . . . . . . . . . . . . . . . . . . . . . . . . . . . . . . . . — 3,000
Deferred tax assets . . . . . . . . . . . . . . . . . . . . . . . . . . . . . . . . . . . . . . . . . . . . . . . . . . 1,115,731 437,736
Other long-term assets . . . . . . . . . . . . . . . . . . . . . . . . . . . . . . . . . . . . . . . . . . . . . . . 145,300 12,396
Total assets . . . . . . . . . . . . . . . . . . . . . . . . . . . . . . . . . . . . . . . . . . . . . . . . . . . $ 8,046,662 $ 8,369,065
LIABILITIES AND STOCKHOLDERS’ (DEFICIT) EQUITY
Current liabilities:
Accounts payable and accrued expenses. . . . . . . . . . . . . . . . . . . . . . . . . . . . $ 625,313 $ 587,755
Accrued interest. . . . . . . . . . . . . . . . . . . . . . . . . . . . . . . . . . . . . . . . . . . . . . . . . . . . 91,655 80,440
Current portion of deferred revenue . . . . . . . . . . . . . . . . . . . . . . . . . . . . . . . . . 1,771,915 1,632,381
Current portion of deferred credit on executory contracts . . . . . . . . . . . . . — 1,394
Current maturities of long-term debt. . . . . . . . . . . . . . . . . . . . . . . . . . . . . . . . . 4,764 7,482
Related party current liabilities . . . . . . . . . . . . . . . . . . . . . . . . . . . . . . . . . . . . . . 2,840 4,340
Total current liabilities . . . . . . . . . . . . . . . . . . . . . . . . . . . . . . . . . . . . . . . . . . . . 2,496,487 2,313,792
Deferred revenue . . . . . . . . . . . . . . . . . . . . . . . . . . . . . . . . . . . . . . . . . . . . . . . . . . . . 157,609 151,901
Long-term debt. . . . . . . . . . . . . . . . . . . . . . . . . . . . . . . . . . . . . . . . . . . . . . . . . . . . . . . 5,443,614 4,487,419
Related party long-term liabilities. . . . . . . . . . . . . . . . . . . . . . . . . . . . . . . . . . . . . . 10,795 13,635
Deferred tax liabilities . . . . . . . . . . . . . . . . . . . . . . . . . . . . . . . . . . . . . . . . . . . . . . . . 6,681 —
Other long-term liabilities . . . . . . . . . . . . . . . . . . . . . . . . . . . . . . . . . . . . . . . . . . . . . 97,967 92,481
Total liabilities . . . . . . . . . . . . . . . . . . . . . . . . . . . . . . . . . . . . . . . . . . . . . . . . . 8,213,153 7,059,228
Commitments and contingencies (Note 16)
Stockholders’ (deficit) equity:
Preferred stock, undesignated, par value $0.001 (liquidation
preference of $0.001 per share); 50,000 shares authorized and
0 shares issued and outstanding at December 31, 2015 and
December 31, 2014, respectively . . . . . . . . . . . . . . . . . . . . . . . . . . . . . . . . . — —
Common stock, par value $0.001; 9,000,000 shares authorized;
5,153,451 and 5,653,529 shares issued; 5,147,647 and 5,646,119
outstanding at December 31, 2015 and December 31, 2014,
respectively. . . . . . . . . . . . . . . . . . . . . . . . . . . . . . . . . . . . . . . . . . . . . . . . . . . . . . 5,153 5,653
Accumulated other comprehensive loss, net of tax . . . . . . . . . . . . . . . . . . . . . (502) (402)
Additional paid-in capital . . . . . . . . . . . . . . . . . . . . . . . . . . . . . . . . . . . . . . . . . . . . . . 4,783,795 6,771,554
Treasury stock, at cost; 5,804 and 7,410 shares of common stock at
December 31, 2015 and December 31, 2014, respectively . . . . . . . . . . . (23,727) (26,034)
Accumulated deficit. . . . . . . . . . . . . . . . . . . . . . . . . . . . . . . . . . . . . . . . . . . . . . . . . . . (4,931,210) (5,440,934)
Total stockholders’ (deficit) equity. . . . . . . . . . . . . . . . . . . . . . . . . . . . . . . (166,491) 1,309,837
Total liabilities and stockholders’ (deficit) equity . . . . . . . . . . . . . . . . . $ 8,046,662 $ 8,369,065
See accompanying notes to the consolidated financial statements.
F-4