XM Radio 2015 Annual Report Download - page 71
Download and view the complete annual report
Please find page 71 of the 2015 XM Radio annual report below. You can navigate through the pages in the report by either clicking on the pages listed below, or by using the keyword search tool below to find specific information within the annual report.-
 1
1 -
2
-
3
-
4
-
5
-
6
-
7
-
8
-
9
-
10
-
11
-
12
-
13
-
14
-
15
-
16
-
17
-
18
-
19
-
20
-
21
-
22
-
23
-
24
-
25
-
26
-
27
-
28
-
29
-
30
-
31
-
32
-
33
-
34
-
35
-
36
-
37
-
38
-
39
-
40
-
41
-
42
-
43
-
44
-
45
-
46
-
47
-
48
-
49
-
50
-
51
-
52
-
53
-
54
-
55
-
56
-
57
-
58
-
59
-
60
-
 61
61 -
 62
62 -
 63
63 -
 64
64 -
 65
65 -
 66
66 -
 67
67 -
 68
68 -
 69
69 -
 70
70 -
 71
71 -
 72
72 -
 73
73 -
 74
74 -
 75
75 -
 76
76 -
 77
77 -
 78
78 -
 79
79 -
 80
80 -
 81
81 -
82
-
83
-
84
-
85
-
86
-
87
-
88
-
89
-
90
-
91
-
92
-
93
-
94
-
95
-
96
-
97
-
98
-
99
-
100
-
101
-
102
-
103
-
104
-
105
-
106
-
107
-
108
-
109
-
110
-
111
-
112
-
113
-
114
-
115
-
116
-
117
-
118
-
119
-
120
-
121
-
122
-
123
-
124
-
125
-
126
-
127
-
128
-
129
-
130
-
131
-
132
 |
 |
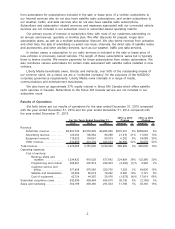
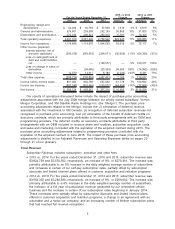
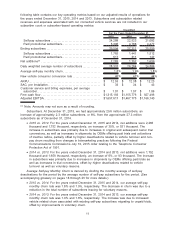
We expect subscriber acquisition costs to fluctuate with OEM installations and aftermarket
volume; however, the cost of subsidized radio components is expected to decline. We intend to
continue to offer subsidies, commissions and other incentives to acquire subscribers.
Sales and Marketing includes costs for marketing, advertising, media and production, including
promotional events and sponsorships; cooperative marketing; and personnel. Marketing costs
include expenses related to direct mail, outbound telemarketing and email communications.
•2015 vs. 2014: For the years ended December 31, 2015 and 2014, sales and marketing
expenses were $354,189 and $336,480, respectively, an increase of 5%, or $17,709, but
decreased as a percentage of total revenue. The increase was primarily due to additional
subscriber communications and retention programs associated with a greater number of
subscribers and promotional trials and higher personnel-related costs.
•2014 vs. 2013: For the years ended December 31, 2014 and 2013, sales and marketing
expenses were $336,480 and $291,024, respectively, an increase of 16%, or $45,456, and
increased as a percentage of total revenue. The increase was primarily due to additional
subscriber communications and retention programs associated with a greater number of
subscribers and promotional trials, the inclusion of a full year of costs associated with our
connected vehicle services business, increased personnel costs, and the elimination of the
benefit to earnings in 2014 from the amortization of the deferred credit for acquired executory
contracts recognized in purchase price accounting associated with the Merger; partially offset
by lower loyalty costs due to a change in a contract with an automaker. The benefit to
earnings from the amortization of the deferred credit for acquired executory contracts for the
year ended December 31, 2013 was $12,922.
We anticipate that sales and marketing expenses will increase as we expand programs to
retain our existing subscribers, win back former subscribers, and attract new subscribers.
Engineering, Design and Development consists primarily of compensation and related costs to
develop chipsets and new products and services, including streaming and connected vehicle
services, research and development for broadcast information systems and costs associated with
the incorporation of our radios into new vehicles manufactured by automakers.
•2015 vs. 2014: For the years ended December 31, 2015 and 2014, engineering, design and
development expenses were $64,403 and $62,784, respectively, an increase of 3%, or
$1,619, and remained flat as a percentage of total revenue. The increase was driven
primarily by additional costs associated with streaming development, partially offset by lower
personnel costs.
•2014 vs. 2013: For the years ended December 31, 2014 and 2013, engineering, design and
development expenses were $62,784 and $57,969, respectively, an increase of 8%, or
$4,815, and remained flat as a percentage of total revenue. The increase was driven
primarily by the inclusion of a full year of costs associated with our connected vehicle
services business and higher personnel costs.
We expect engineering, design and development expenses to increase in future periods as we
continue to develop our infrastructure, products and services.
General and Administrative primarily consists of compensation and related costs for personnel
and facilities, and include costs related to our finance, legal, human resources and information
technologies departments.
•2015 vs. 2014: For the years ended December 31, 2015 and 2014, general and
administrative expenses were $324,801 and $293,938, respectively, an increase of 10%, or
$30,863, and remained flat as a percentage of total revenue. The increase was driven
primarily by higher personnel costs, reserves for consumer legal settlements and facilities
costs, partially offset by insurance recoveries and lower professional fees related to the
proposal made in January 2014 by Liberty Media to acquire the balance of our common
stock not already owned by it.
•2014 vs. 2013: For the years ended December 31, 2014 and 2013, general and
administrative expenses were $293,938 and $262,135, respectively, an increase of 12%, or
7