XM Radio 2015 Annual Report Download - page 88
Download and view the complete annual report
Please find page 88 of the 2015 XM Radio annual report below. You can navigate through the pages in the report by either clicking on the pages listed below, or by using the keyword search tool below to find specific information within the annual report.-
 1
1 -
2
-
3
-
4
-
5
-
6
-
7
-
8
-
9
-
10
-
11
-
12
-
13
-
14
-
15
-
16
-
17
-
18
-
19
-
20
-
21
-
22
-
23
-
24
-
25
-
26
-
27
-
28
-
29
-
30
-
31
-
32
-
33
-
34
-
35
-
36
-
37
-
38
-
39
-
40
-
41
-
42
-
43
-
44
-
45
-
46
-
47
-
48
-
49
-
50
-
51
-
52
-
53
-
54
-
55
-
56
-
57
-
58
-
59
-
60
-
61
-
62
-
63
-
64
-
65
-
66
-
67
-
68
-
69
-
70
-
71
-
72
-
73
-
74
-
75
-
76
-
77
-
 78
78 -
 79
79 -
 80
80 -
 81
81 -
 82
82 -
 83
83 -
 84
84 -
 85
85 -
 86
86 -
 87
87 -
 88
88 -
 89
89 -
 90
90 -
 91
91 -
 92
92 -
 93
93 -
 94
94 -
 95
95 -
 96
96 -
 97
97 -
 98
98 -
99
-
100
-
101
-
102
-
103
-
104
-
105
-
106
-
107
-
108
-
109
-
110
-
111
-
112
-
113
-
114
-
115
-
116
-
117
-
118
-
119
-
120
-
121
-
122
-
123
-
124
-
125
-
126
-
127
-
128
-
129
-
130
-
131
-
132
 |
 |

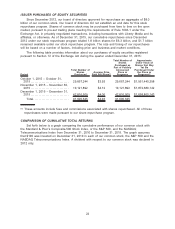
ISSUER PURCHASES OF EQUITY SECURITIES
Since December 2012, our board of directors approved for repurchase an aggregate of $8.0
billion of our common stock. Our board of directors did not establish an end date for this stock
repurchase program. Shares of common stock may be purchased from time to time on the open
market, pursuant to pre-set trading plans meeting the requirements of Rule 10b5-1 under the
Exchange Act, in privately negotiated transactions, including transactions with Liberty Media and its
affiliates, or otherwise. As of December 31, 2015, our cumulative repurchases since December
2012 under our stock repurchase program totaled 1.8 billion shares for $6.3 billion, and $1.7 billion
remained available under our stock repurchase program. The size and timing of our repurchases
will be based on a number of factors, including price and business and market conditions.
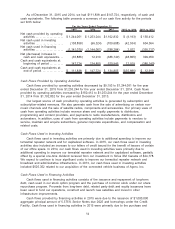
The following table provides information about our purchases of equity securities registered
pursuant to Section 12 of the Exchange Act during the quarter ended December 31, 2015:
Period
Total Number of
Shares
Purchased
Average Price
Paid Per Share(a)
Total Number of
Shares
Purchased as
Part of Publicly
Announced
Plans or
Programs
Approximate
Dollar Value of
Shares that May
Yet Be
Purchased Under
the Plans or
Programs(a)
October 1, 2015 – October 31,
2015 . . . . . . . . . . . . . . . . . . . . . . . . . . . . 29,667,244 $3.93 29,667,244 $1,951,440,398
November 1, 2015 – November 30,
2015 . . . . . . . . . . . . . . . . . . . . . . . . . . . . 19,121,892 $4.12 19,121,892 $1,872,689,142
December 1, 2015 – December 31,
2015 . . . . . . . . . . . . . . . . . . . . . . . . . . . . 42,816,509 $4.06 42,816,509 $1,698,860,143
Total . . . . . . . . . . . . . . . . . . . . . . . . . . 91,605,645 $4.03 91,605,645
(a) These amounts include fees and commissions associated with shares repurchased. All of these
repurchases were made pursuant to our share repurchase program.
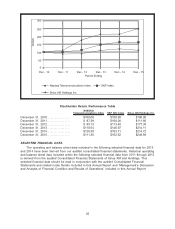
COMPARISON OF CUMULATIVE TOTAL RETURNS
Set forth below is a graph comparing the cumulative performance of our common stock with
the Standard & Poor’s Composite-500 Stock Index, or the S&P 500, and the NASDAQ
Telecommunications Index from December 31, 2010 to December 31, 2015. The graph assumes
that $100 was invested on December 31, 2010 in each of our common stock, the S&P 500 and the
NASDAQ Telecommunications Index. A dividend with respect to our common stock was declared in
2012 only.
24