UPS 2007 Annual Report Download - page 99
Download and view the complete annual report
Please find page 99 of the 2007 UPS annual report below. You can navigate through the pages in the report by either clicking on the pages listed below, or by using the keyword search tool below to find specific information within the annual report.-
 1
1 -
2
-
3
-
4
-
5
-
6
-
7
-
8
-
9
-
10
-
11
-
12
-
13
-
14
-
15
-
16
-
17
-
18
-
19
-
20
-
21
-
22
-
23
-
24
-
25
-
26
-
27
-
28
-
29
-
30
-
31
-
32
-
33
-
34
-
35
-
36
-
37
-
38
-
39
-
40
-
41
-
42
-
43
-
44
-
45
-
46
-
47
-
48
-
49
-
50
-
51
-
52
-
53
-
54
-
55
-
56
-
57
-
58
-
59
-
60
-
61
-
62
-
63
-
64
-
65
-
66
-
67
-
68
-
69
-
70
-
71
-
72
-
73
-
74
-
75
-
76
-
77
-
78
-
79
-
80
-
81
-
82
-
83
-
84
-
85
-
86
-
87
-
88
-
 89
89 -
 90
90 -
 91
91 -
 92
92 -
 93
93 -
 94
94 -
 95
95 -
 96
96 -
 97
97 -
 98
98 -
 99
99 -
 100
100 -
 101
101 -
 102
102 -
 103
103 -
 104
104 -
 105
105 -
 106
106 -
 107
107 -
 108
108 -
 109
109 -
110
-
111
-
112
-
113
-
114
-
115
 |
 |

UNITED PARCEL SERVICE, INC. AND SUBSIDIARIES
NOTES TO CONSOLIDATED FINANCIAL STATEMENTS—(Continued)
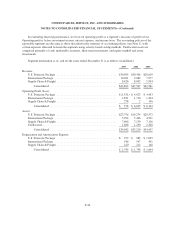
In evaluating financial performance, we focus on operating profit as a segment’s measure of profit or loss.
Operating profit is before investment income, interest expense, and income taxes. The accounting policies of the
reportable segments are the same as those described in the summary of accounting policies (see Note 1), with
certain expenses allocated between the segments using activity-based costing methods. Unallocated assets are
comprised primarily of cash, marketable securities, short-term investments, and equity-method real estate
investments.
Segment information as of, and for the years ended, December 31 is as follows (in millions):
2007 2006 2005
Revenue:
U.S. Domestic Package .......................................... $30,985 $30,456 $28,610
International Package ............................................ 10,281 9,089 7,977
Supply Chain & Freight .......................................... 8,426 8,002 5,994
Consolidated ............................................... $49,692 $47,547 $42,581
Operating Profit (Loss):
U.S. Domestic Package .......................................... $(1,531) $ 4,923 $ 4,493
International Package ............................................ 1,831 1,710 1,494
Supply Chain & Freight .......................................... 278 2 156
Consolidated ............................................... $ 578 $ 6,635 $ 6,143
Assets:
U.S. Domestic Package .......................................... $23,756 $19,274 $20,572
International Package ............................................ 5,994 5,496 4,931
Supply Chain & Freight .......................................... 7,606 7,150 7,116
Unallocated .................................................... 1,686 1,290 2,328
Consolidated ............................................... $39,042 $33,210 $34,947
Depreciation and Amortization Expense:
U.S. Domestic Package .......................................... $ 979 $ 989 $ 1,005
International Package ............................................ 546 547 491
Supply Chain & Freight .......................................... 220 212 148
Consolidated ............................................... $ 1,745 $ 1,748 $ 1,644
F-36