UPS 2007 Annual Report Download - page 100
Download and view the complete annual report
Please find page 100 of the 2007 UPS annual report below. You can navigate through the pages in the report by either clicking on the pages listed below, or by using the keyword search tool below to find specific information within the annual report.-
 1
1 -
2
-
3
-
4
-
5
-
6
-
7
-
8
-
9
-
10
-
11
-
12
-
13
-
14
-
15
-
16
-
17
-
18
-
19
-
20
-
21
-
22
-
23
-
24
-
25
-
26
-
27
-
28
-
29
-
30
-
31
-
32
-
33
-
34
-
35
-
36
-
37
-
38
-
39
-
40
-
41
-
42
-
43
-
44
-
45
-
46
-
47
-
48
-
49
-
50
-
51
-
52
-
53
-
54
-
55
-
56
-
57
-
58
-
59
-
60
-
61
-
62
-
63
-
64
-
65
-
66
-
67
-
68
-
69
-
70
-
71
-
72
-
73
-
74
-
75
-
76
-
77
-
78
-
79
-
80
-
81
-
82
-
83
-
84
-
85
-
86
-
87
-
88
-
89
-
 90
90 -
 91
91 -
 92
92 -
 93
93 -
 94
94 -
 95
95 -
 96
96 -
 97
97 -
 98
98 -
 99
99 -
 100
100 -
 101
101 -
 102
102 -
 103
103 -
 104
104 -
 105
105 -
 106
106 -
 107
107 -
 108
108 -
 109
109 -
 110
110 -
111
-
112
-
113
-
114
-
115
 |
 |

UNITED PARCEL SERVICE, INC. AND SUBSIDIARIES
NOTES TO CONSOLIDATED FINANCIAL STATEMENTS—(Continued)
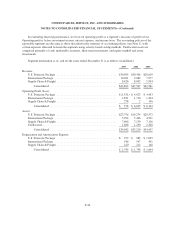
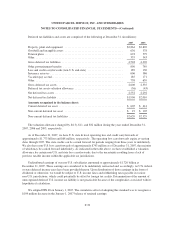
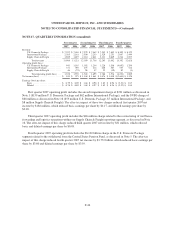
Revenue by product type for the years ended December 31 is as follows (in millions):
2007 2006 2005
U.S. Domestic Package:
Next Day Air .................................................. $ 6,738 $ 6,778 $ 6,381
Deferred ...................................................... 3,359 3,424 3,258
Ground ....................................................... 20,888 20,254 18,971
Total U.S. Domestic Package .................................. 30,985 30,456 28,610
International Package:
Domestic ...................................................... 2,177 1,950 1,588
Export ........................................................ 7,488 6,554 5,856
Cargo ........................................................ 616 585 533
Total International Package ................................... 10,281 9,089 7,977
Supply Chain & Freight:
Forwarding and Logistics ......................................... 5,911 5,681 4,859
Freight ....................................................... 2,108 1,952 797
Other ......................................................... 407 369 338
Total Supply Chain & Freight ................................. 8,426 8,002 5,994
Consolidated ................................................... $49,692 $47,547 $42,581
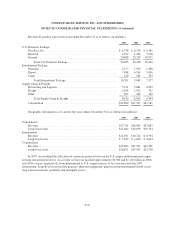
Geographic information as of, and for the years ended, December 31 is as follows (in millions):
2007 2006 2005
United States:
Revenue ...................................................... $37,741 $36,805 $33,987
Long-lived assets ............................................... $21,662 $18,659 $19,704
International:
Revenue ...................................................... $11,951 $10,742 $ 8,594
Long-lived assets ............................................... $ 5,189 $ 4,800 $ 4,044
Consolidated:
Revenue ...................................................... $49,692 $47,547 $42,581
Long-lived assets ............................................... $26,851 $23,459 $23,748
In 2007, we modified the allocation of certain air products between the U.S. origin and International origin
revenue data presented above. As a result, we have reclassified approximately $2.360 and $2.116 billion in 2006
and 2005 revenue, respectively, from International to U.S. origin services, to be consistent with the 2007
presentation. Long-lived assets include property, plant and equipment, pension and postretirement benefit assets,
long-term investments, goodwill, and intangible assets.
F-37