UPS 2007 Annual Report Download - page 96
Download and view the complete annual report
Please find page 96 of the 2007 UPS annual report below. You can navigate through the pages in the report by either clicking on the pages listed below, or by using the keyword search tool below to find specific information within the annual report.-
 1
1 -
2
-
3
-
4
-
5
-
6
-
7
-
8
-
9
-
10
-
11
-
12
-
13
-
14
-
15
-
16
-
17
-
18
-
19
-
20
-
21
-
22
-
23
-
24
-
25
-
26
-
27
-
28
-
29
-
30
-
31
-
32
-
33
-
34
-
35
-
36
-
37
-
38
-
39
-
40
-
41
-
42
-
43
-
44
-
45
-
46
-
47
-
48
-
49
-
50
-
51
-
52
-
53
-
54
-
55
-
56
-
57
-
58
-
59
-
60
-
61
-
62
-
63
-
64
-
65
-
66
-
67
-
68
-
69
-
70
-
71
-
72
-
73
-
74
-
75
-
76
-
77
-
78
-
79
-
80
-
81
-
82
-
83
-
84
-
85
-
 86
86 -
 87
87 -
 88
88 -
 89
89 -
 90
90 -
 91
91 -
 92
92 -
 93
93 -
 94
94 -
 95
95 -
 96
96 -
 97
97 -
 98
98 -
 99
99 -
 100
100 -
 101
101 -
 102
102 -
 103
103 -
 104
104 -
 105
105 -
 106
106 -
107
-
108
-
109
-
110
-
111
-
112
-
113
-
114
-
115
 |
 |

UNITED PARCEL SERVICE, INC. AND SUBSIDIARIES
NOTES TO CONSOLIDATED FINANCIAL STATEMENTS—(Continued)
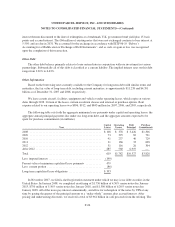
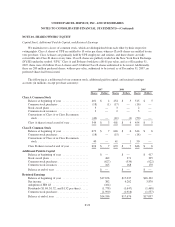
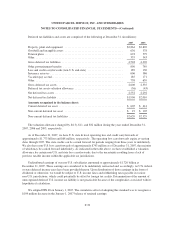
The following is an analysis of options to purchase shares of class A common stock issued and outstanding:
Shares
(in thousands)
Weighted
Average
Exercise
Price
Weighted Average Remaining
Contractual Term
(in years)
Aggregate Intrinsic
Value (in millions)
Outstanding at January 1, 2007 ........ 18,882 $64.75
Exercised ......................... (1,851) 57.03
Granted .......................... 2,736 70.90
Forfeited / Expired ................. (544) 69.68
Outstanding at December 31, 2007 ..... 19,223 $66.23 5.96 $114
Exercisable at December 31, 2007 ..... 8,829 $59.87 4.13 $ 99
Options Expected to Vest ............ 10,118 $71.45 7.43 $ 16
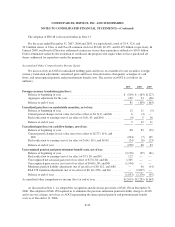
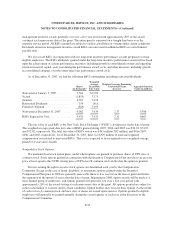
The fair value of each option grant is estimated using the Black-Scholes option pricing model. The weighted
average assumptions used, by year, and the calculated weighted average fair values of options are as follows:
2007 2006 2005
Expected dividend yield ............................................... 2.28% 1.80% 1.60%
Risk-free interest rate ................................................. 4.65% 5.13% 4.18%
Expected life in years ................................................. 7.5 7.0 7.0
Expected volatility ................................................... 19.15% 18.42% 18.21%
Weighted average fair value of options granted ............................ $16.85 $21.05 $17.33
Expected volatilities are based on the historical returns on our stock and, due to our limited history of being
a publicly-traded company, an index of peer companies, as well as the implied volatility of our publicly-traded
options. The expected dividend yield is based on the recent historical dividend yields for our stock, taking into
account changes in dividend policy. The risk-free interest rate is based on the term structure of interest rates at
the time of the option grant. The expected life represents an estimate of the period of time options are expected to
remain outstanding, and we have relied upon a combination of the observed exercise behavior of our prior grants
with similar characteristics, the vesting schedule of the grants, and an index of peer companies with similar grant
characteristics.
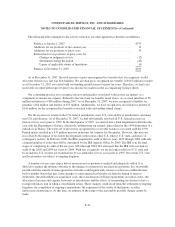
We received cash of $52, $30, and $21 million during 2007, 2006, and 2005, respectively, from option
holders resulting from the exercise of stock options. We received a tax benefit of $9, $12, and $5 million during
2007, 2006, and 2005, respectively, from the exercise of stock options. The adoption of FAS 123(R) required us
to change the statement of cash flow classification of these tax benefits, and as a result, these tax benefits are
reported as cash from financing activities rather than cash from operating activities.
The total intrinsic value of options exercised during 2007, 2006, and 2005 was $31, $45, and $24 million,
respectively. As of December 31, 2007, there was $77 million of total unrecognized compensation cost related to
nonvested options. That cost is expected to be recognized over a weighted average period of 3 years and 3
months.
F-33