UPS 2007 Annual Report Download - page 41
Download and view the complete annual report
Please find page 41 of the 2007 UPS annual report below. You can navigate through the pages in the report by either clicking on the pages listed below, or by using the keyword search tool below to find specific information within the annual report.-
 1
1 -
2
-
3
-
4
-
5
-
6
-
7
-
8
-
9
-
10
-
11
-
12
-
13
-
14
-
15
-
16
-
17
-
18
-
19
-
20
-
21
-
22
-
23
-
24
-
25
-
26
-
27
-
28
-
29
-
30
-
 31
31 -
 32
32 -
 33
33 -
 34
34 -
 35
35 -
 36
36 -
 37
37 -
 38
38 -
 39
39 -
 40
40 -
 41
41 -
 42
42 -
 43
43 -
 44
44 -
 45
45 -
 46
46 -
 47
47 -
 48
48 -
 49
49 -
 50
50 -
 51
51 -
52
-
53
-
54
-
55
-
56
-
57
-
58
-
59
-
60
-
61
-
62
-
63
-
64
-
65
-
66
-
67
-
68
-
69
-
70
-
71
-
72
-
73
-
74
-
75
-
76
-
77
-
78
-
79
-
80
-
81
-
82
-
83
-
84
-
85
-
86
-
87
-
88
-
89
-
90
-
91
-
92
-
93
-
94
-
95
-
96
-
97
-
98
-
99
-
100
-
101
-
102
-
103
-
104
-
105
-
106
-
107
-
108
-
109
-
110
-
111
-
112
-
113
-
114
-
115
 |
 |
In January 2006, we increased rates 5.5% for international shipments originating in the United States
(Worldwide Express, Worldwide Express Plus, UPS Worldwide Expedited and UPS International Standard
service). Rate changes for international shipments originating outside the United States varied by geographical
market and occurred throughout the year.
Also in January 2006, we modified the fuel surcharge on certain U.S.-related international air services by
reducing the index used to determine the fuel surcharge by 2%. The air fuel surcharge continued to remain
subject to a maximum cap of 12.5% through June 4, 2006. Effective June 5, 2006, we reduced the index by
another 2% and no longer applied a cap to the air fuel surcharge. The fuel surcharge for products originating
outside the United States continued to be indexed to fuel prices in our different international regions, depending
upon where the shipment took place. Total international fuel surcharge revenue increased by $189 million during
the year due to higher jet fuel prices and increased international air volume.
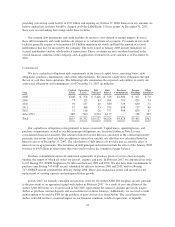
Export volume increased throughout the world, with solid volume increases in Europe, Asia, and U.S.
export products. Asian export volume continued to benefit from geographic service expansion and strong
economic growth in Asia, while European export volume gains were impacted by our growing transborder
business and the expansion of the European Union. International domestic volume increased 21.0% for the year,
due to volume growth in Canada and Europe, which also benefited from the acquisition of Stolica in Poland
during the second quarter of 2005 and the acquisition of Lynx in the U.K. during the third quarter of 2005.
Excluding the impact of acquisitions, international domestic volume and revenue increased 6.9% and 8.3%,
respectively, for the year.
Export revenue per piece increased 0.5% for the year, largely due to the rate increases discussed previously,
the impact of the fuel surcharge, and currency fluctuations, partially offset by relatively higher growth in lower
revenue per piece transborder products. For the year, total international average daily package volume increased
17.3%, while average revenue per piece decreased 2.2% (decreased 3.3% currency-adjusted).
The improvement in operating profit for our International Package segment was $216 million for the year,
or 14.5%, and the operating margin increased 10 basis points to 18.8%. The increases in operating profit and
margin were driven by the volume and revenue growth described previously. The change in operating profit was
also positively affected by $26 million during the year due to currency fluctuations.
Supply Chain & Freight Operations
2007 compared to 2006
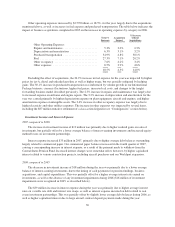
Supply Chain & Freight revenue increased $424 million, or 5.3%, in 2007. Forwarding and logistics revenue
increased $230 million, or 4.0%, for the year, and was affected by favorable exchange rate movements and
revenue management initiatives begun in 2006. Favorable exchange rate movements positively affected the
growth in revenue by $178 million during the year. Revenue growth in this business was driven by improvements
in international air freight and mail services, which were impacted by overall market growth and lower customer
turnover rates.
UPS Freight increased revenue $156 million, or 8.0%, for the year as a result of improved yields and a
strong increase in average daily shipment volume. Average LTL shipments per day increased 8.3% during the
year, driven by new customer wins and leveraging our existing small package customer base for new sales
opportunities. LTL revenue per hundredweight increased 9.3% during the year, due to an increase in base rates in
2007 and a focus on higher-yielding customer segments. The increase in revenue per hundredweight and average
daily shipments were somewhat offset by a 7.5% decrease for the year in the LTL weight per shipment.
The other businesses within Supply Chain & Freight, which include our retail franchising business, our
financial business, and our U.S. domestic cargo operations, increased revenue by 10.3% during the year. This
revenue growth was primarily due to increased revenue from our contract to provide domestic air transportation
services for the U.S. Postal Service.
26