UPS 2007 Annual Report Download - page 45
Download and view the complete annual report
Please find page 45 of the 2007 UPS annual report below. You can navigate through the pages in the report by either clicking on the pages listed below, or by using the keyword search tool below to find specific information within the annual report.-
 1
1 -
2
-
3
-
4
-
5
-
6
-
7
-
8
-
9
-
10
-
11
-
12
-
13
-
14
-
15
-
16
-
17
-
18
-
19
-
20
-
21
-
22
-
23
-
24
-
25
-
26
-
27
-
28
-
29
-
30
-
31
-
32
-
33
-
34
-
 35
35 -
 36
36 -
 37
37 -
 38
38 -
 39
39 -
 40
40 -
 41
41 -
 42
42 -
 43
43 -
 44
44 -
 45
45 -
 46
46 -
 47
47 -
 48
48 -
 49
49 -
 50
50 -
 51
51 -
 52
52 -
 53
53 -
 54
54 -
 55
55 -
56
-
57
-
58
-
59
-
60
-
61
-
62
-
63
-
64
-
65
-
66
-
67
-
68
-
69
-
70
-
71
-
72
-
73
-
74
-
75
-
76
-
77
-
78
-
79
-
80
-
81
-
82
-
83
-
84
-
85
-
86
-
87
-
88
-
89
-
90
-
91
-
92
-
93
-
94
-
95
-
96
-
97
-
98
-
99
-
100
-
101
-
102
-
103
-
104
-
105
-
106
-
107
-
108
-
109
-
110
-
111
-
112
-
113
-
114
-
115
 |
 |

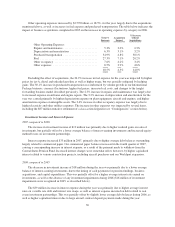
Other operating expenses increased by $2.570 billion, or 18.5%, for the year, largely due to the acquisitions
mentioned above, as well as increases in fuel expense and purchased transportation. The table below indicates the
impact of business acquisitions completed in 2005 on the increase in operating expenses by category in 2006.
Total %
Increase
Acquisition
Impact
% Increase
without
Acquisitions
Other Operating Expenses:
Repairs and maintenance ........................ 5.3% 3.0% 2.3%
Depreciation and amortization ................... 6.3% 3.1% 3.2%
Purchased transportation ........................ 34.9% 4.8% 30.1%
Fuel ........................................ 27.3% 7.1% 20.2%
Other occupancy .............................. 7.6% 4.2% 3.4%
Other expenses ............................... 8.5% 3.9% 4.6%
18.5% 4.5% 14.0%
Excluding the effect of acquisitions, the 20.2% increase in fuel expense for the year was impacted by higher
prices for jet-A, diesel and unleaded gasoline as well as higher usage, but was partially mitigated by hedging
gains. The 30.1% increase in purchased transportation was influenced by volume growth in our International
Package business, currency fluctuations, higher fuel prices, increased rail costs, and changes to the freight
forwarding business model described previously. The 2.3% increase in repairs and maintenance was largely due
to increased expense on airframe and engine repairs. The 3.2% increase in depreciation and amortization for the
year was caused primarily by higher depreciation expense on plant equipment, aircraft and engines, and higher
amortization expense on intangible assets. The 3.4% increase in other occupancy expense was largely due to
higher electricity and other utilities expenses. The increase in other expenses was impacted by several items,
including the $87 million tentative settlement of a class action litigation (see “Contingencies” section below).
Investment Income and Interest Expense
2007 compared to 2006
The increase in investment income of $13 million was primarily due to higher realized gains on sales of
investments, but partially offset by a lower average balance of interest-earning investments and increased equity-
method losses on investment partnerships.
Interest expense increased $35 million in 2007, primarily due to higher average debt balances outstanding,
largely related to commercial paper. Our commercial paper balances increased in the fourth quarter of 2007,
causing a corresponding increase in interest expense, as a result of the payment made to withdraw from the
Central States Pension Fund. Increased interest charges were somewhat offset, however, by higher capitalized
interest related to various construction projects, including aircraft purchases and our Worldport expansion.
2006 compared to 2005
The decrease in investment income of $18 million during the year was primarily due to a lower average
balance of interest-earning investments, due to the timing of cash payments for pension fundings, business
acquisitions, and capital expenditures. This was partially offset by a higher average interest rate earned on
investments, as well as the absence of any investment impairments during 2006 ($16 million of investment
impairments were recognized in 2005, as described below).
The $39 million increase in interest expense during the year was primarily due to higher average interest
rates on variable rate debt and interest rate swaps, as well as interest expense incurred on debt related to real
estate investment partnerships. This was partially offset by slightly lower average debt balances during 2006, as
well as higher capitalized interest due to large aircraft contract deposit payments made during the year.
30