UPS 2007 Annual Report Download - page 39
Download and view the complete annual report
Please find page 39 of the 2007 UPS annual report below. You can navigate through the pages in the report by either clicking on the pages listed below, or by using the keyword search tool below to find specific information within the annual report.-
 1
1 -
2
-
3
-
4
-
5
-
6
-
7
-
8
-
9
-
10
-
11
-
12
-
13
-
14
-
15
-
16
-
17
-
18
-
19
-
20
-
21
-
22
-
23
-
24
-
25
-
26
-
27
-
28
-
 29
29 -
 30
30 -
 31
31 -
 32
32 -
 33
33 -
 34
34 -
 35
35 -
 36
36 -
 37
37 -
 38
38 -
 39
39 -
 40
40 -
 41
41 -
 42
42 -
 43
43 -
 44
44 -
 45
45 -
 46
46 -
 47
47 -
 48
48 -
 49
49 -
50
-
51
-
52
-
53
-
54
-
55
-
56
-
57
-
58
-
59
-
60
-
61
-
62
-
63
-
64
-
65
-
66
-
67
-
68
-
69
-
70
-
71
-
72
-
73
-
74
-
75
-
76
-
77
-
78
-
79
-
80
-
81
-
82
-
83
-
84
-
85
-
86
-
87
-
88
-
89
-
90
-
91
-
92
-
93
-
94
-
95
-
96
-
97
-
98
-
99
-
100
-
101
-
102
-
103
-
104
-
105
-
106
-
107
-
108
-
109
-
110
-
111
-
112
-
113
-
114
-
115
 |
 |
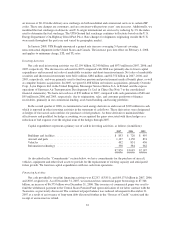
accruals for workers’ compensation claims, automotive liability and general business liabilities declined as a result
of several factors. The Central States Pension Fund withdrawal, aircraft impairment, and SVSO charges, as well as
the impact of lower self-insurance expense, are discussed further in the “Operating Expenses” section.
2006 compared to 2005
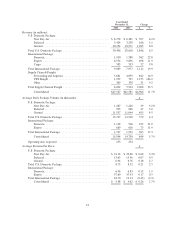
U.S. Domestic Package revenue increased $1.846 billion, or 6.5%, for the year, with average daily package
volume up 4.4%. Volume gains were realized across all products primarily due to a solid U.S. economy, strong
small package market and continuing efforts to generate new volume. Overall domestic volume growth
moderated in the latter half of 2006 compared with 2005, due to slower overall economic growth in the U.S. and
a downturn in industrial production during the fourth quarter.
Pricing remained firm as overall revenue per piece was up 2.5% for the year. Ground revenue per piece
increased 2.7% and Next Day Air revenue per piece increased 3.3% for the year, primarily due to the impact of a
rate increase that took effect in 2006 and the impact of an increased fuel surcharge rate in 2006 compared to
2005. Deferred revenue per piece increased 0.5% for the year for the same reasons, but was adversely affected by
the growth in lighter weight, lower revenue packages.
On January 2, 2006, a rate increase took effect which was in line with previous years’ rate increases. We
increased rates 5.5% on UPS Next Day Air, UPS 2nd Day Air, and UPS 3 Day Select, and 3.9% on UPS Ground.
Other pricing changes included a new charge for undeliverable packages after three delivery attempts and an
increase in rates for proof of delivery features for our Delivery Required and Signature Confirmation services.
The residential surcharge increased $0.25 for UPS Ground services and $0.35 for UPS Next Day Air, UPS 2nd
Day Air and UPS 3 Day Select.
In January 2006, we modified the fuel surcharge on domestic air services by reducing the index used to
determine the fuel surcharge by 2%. The air fuel surcharge was subject to a maximum cap of 12.50% through
June 4, 2006. Effective June 5, 2006, we reduced the index by another 2% and no longer applied a cap to the air
fuel surcharge. This fuel surcharge continued to be based on the U.S. Energy Department’s Gulf Coast spot price
for a gallon of kerosene-type jet fuel. Based on published rates, the average fuel surcharge on domestic air
products was 14.02% in 2006, as compared with 10.23% in 2005. Additionally, the UPS Ground fuel surcharge
continued to fluctuate based on the U.S. Energy Department’s On-Highway Diesel Fuel Price. Based on
published rates, the average fuel surcharge on domestic ground products was 4.13% in 2006, as compared to
2.86% in 2005. Total domestic fuel surcharge revenue increased by $542 million in 2006, due to higher jet and
diesel fuel prices, volume growth, and the modifications to our fuel surcharges noted above. These fuel
surcharges are used to provide some protection against the increased fuel expense that we incur due to higher fuel
prices, as well as the increased purchased transportation expense which is also affected by higher fuel prices.
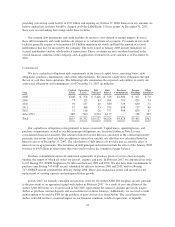
U.S. Domestic Package operating profit increased $430 million, or 9.6%, for the year, and the operating
margin increased by approximately 50 basis points to 16.2%. This increase was primarily a result of the revenue
growth described previously, combined with efficiencies from leveraging our integrated ground and air networks.
The 2006 operating profit for our U.S. Domestic Package segment was negatively impacted by the settlement of
a class action litigation (see “Contingencies” section below), which resulted in an $87 million charge to expense.
Operating profit for this segment was positively affected as a result of lower expense associated with our self-
insurance accruals for workers’ compensation claims, automotive liability and general business liabilities in 2006
compared with 2005.
International Package Operations
2007 compared to 2006
International Package revenue improved $1.192 billion, or 13.1% in 2007, driven by a 10.4% volume
increase for our export products and an 8.3% increase in total revenue per piece. The growth in revenue per piece
24