UPS 2007 Annual Report Download - page 36
Download and view the complete annual report
Please find page 36 of the 2007 UPS annual report below. You can navigate through the pages in the report by either clicking on the pages listed below, or by using the keyword search tool below to find specific information within the annual report.-
 1
1 -
2
-
3
-
4
-
5
-
6
-
7
-
8
-
9
-
10
-
11
-
12
-
13
-
14
-
15
-
16
-
17
-
18
-
19
-
20
-
21
-
22
-
23
-
24
-
25
-
 26
26 -
 27
27 -
 28
28 -
 29
29 -
 30
30 -
 31
31 -
 32
32 -
 33
33 -
 34
34 -
 35
35 -
 36
36 -
 37
37 -
 38
38 -
 39
39 -
 40
40 -
 41
41 -
 42
42 -
 43
43 -
 44
44 -
 45
45 -
 46
46 -
47
-
48
-
49
-
50
-
51
-
52
-
53
-
54
-
55
-
56
-
57
-
58
-
59
-
60
-
61
-
62
-
63
-
64
-
65
-
66
-
67
-
68
-
69
-
70
-
71
-
72
-
73
-
74
-
75
-
76
-
77
-
78
-
79
-
80
-
81
-
82
-
83
-
84
-
85
-
86
-
87
-
88
-
89
-
90
-
91
-
92
-
93
-
94
-
95
-
96
-
97
-
98
-
99
-
100
-
101
-
102
-
103
-
104
-
105
-
106
-
107
-
108
-
109
-
110
-
111
-
112
-
113
-
114
-
115
 |
 |

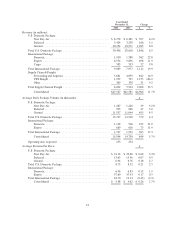
Year Ended
December 31, Change
2006 2005 $ %
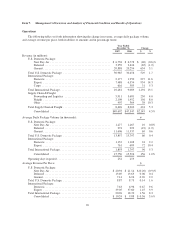
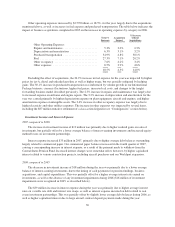
Revenue (in millions):
U.S. Domestic Package:
Next Day Air ......................................... $ 6,778 $ 6,381 $ 397 6.2%
Deferred ............................................. 3,424 3,258 166 5.1
Ground .............................................. 20,254 18,971 1,283 6.8
Total U.S. Domestic Package ................................ 30,456 28,610 1,846 6.5
International Package:
Domestic ............................................ 1,950 1,588 362 22.8
Export .............................................. 6,554 5,856 698 11.9
Cargo ............................................... 585 533 52 9.8
Total International Package .................................. 9,089 7,977 1,112 13.9
Supply Chain & Freight:
Forwarding and Logistics ............................... 5,681 4,859 822 16.9
UPS Freight .......................................... 1,952 797 1,155 144.9
Other ............................................... 369 338 31 9.2
Total Supply Chain & Freight ................................ 8,002 5,994 2,008 33.5
Consolidated ......................................... $47,547 $42,581 $4,966 11.7%
Average Daily Package Volume (in thousands): #
U.S. Domestic Package:
Next Day Air ......................................... 1,267 1,228 39 3.2%
Deferred ............................................. 993 946 47 5.0
Ground .............................................. 11,537 11,044 493 4.5
Total U.S. Domestic Package ................................ 13,797 13,218 579 4.4
International Package:
Domestic ............................................ 1,108 916 192 21.0
Export .............................................. 689 616 73 11.9
Total International Package .................................. 1,797 1,532 265 17.3
Consolidated ......................................... 15,594 14,750 844 5.7%
Operating days in period .................................... 253 254
Average Revenue Per Piece: $
U.S. Domestic Package:
Next Day Air ......................................... $ 21.14 $ 20.46 $ 0.68 3.3%
Deferred ............................................. 13.63 13.56 0.07 0.5
Ground .............................................. 6.94 6.76 0.18 2.7
Total U.S. Domestic Package ................................ 8.73 8.52 0.21 2.5
International Package:
Domestic ............................................ 6.96 6.83 0.13 1.9
Export .............................................. 37.60 37.43 0.17 0.5
Total International Package .................................. 18.70 19.13 (0.43) (2.2)
Consolidated ......................................... $ 9.88 $ 9.62 $ 0.26 2.7%
21