UPS 2007 Annual Report Download - page 81
Download and view the complete annual report
Please find page 81 of the 2007 UPS annual report below. You can navigate through the pages in the report by either clicking on the pages listed below, or by using the keyword search tool below to find specific information within the annual report.-
 1
1 -
2
-
3
-
4
-
5
-
6
-
7
-
8
-
9
-
10
-
11
-
12
-
13
-
14
-
15
-
16
-
17
-
18
-
19
-
20
-
21
-
22
-
23
-
24
-
25
-
26
-
27
-
28
-
29
-
30
-
31
-
32
-
33
-
34
-
35
-
36
-
37
-
38
-
39
-
40
-
41
-
42
-
43
-
44
-
45
-
46
-
47
-
48
-
49
-
50
-
51
-
52
-
53
-
54
-
55
-
56
-
57
-
58
-
59
-
60
-
61
-
62
-
63
-
64
-
65
-
66
-
67
-
68
-
69
-
70
-
 71
71 -
 72
72 -
 73
73 -
 74
74 -
 75
75 -
 76
76 -
 77
77 -
 78
78 -
 79
79 -
 80
80 -
 81
81 -
 82
82 -
 83
83 -
 84
84 -
 85
85 -
 86
86 -
 87
87 -
 88
88 -
 89
89 -
 90
90 -
 91
91 -
92
-
93
-
94
-
95
-
96
-
97
-
98
-
99
-
100
-
101
-
102
-
103
-
104
-
105
-
106
-
107
-
108
-
109
-
110
-
111
-
112
-
113
-
114
-
115
 |
 |

UNITED PARCEL SERVICE, INC. AND SUBSIDIARIES
NOTES TO CONSOLIDATED FINANCIAL STATEMENTS—(Continued)
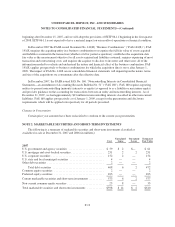
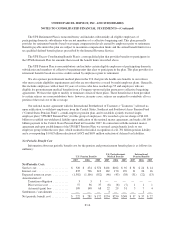
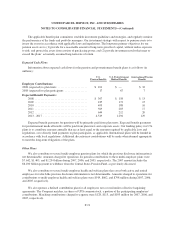
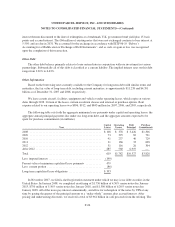
Assumed health care cost trends have a significant effect on the amounts reported for the U.S.
postretirement medical plans. A one-percent change in assumed health care cost trend rates would have the
following effects (in millions):
1% Increase 1% Decrease
Effect on total of service cost and interest cost ...................... $ 6 $ (5)
Effect on postretirement benefit obligation ......................... 84 (82)
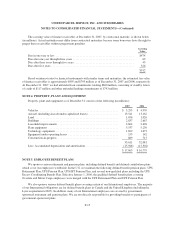
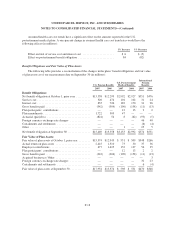
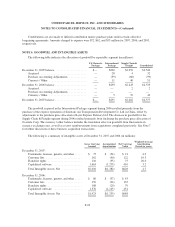
Benefit Obligations and Fair Value of Plan Assets
The following table provides a reconciliation of the changes in the plans’ benefit obligations and fair value
of plan assets as of our measurement date on September 30 (in millions):
U.S. Pension Benefits
U.S. Postretirement
Medical Benefits
International
Pension
Benefits
2007 2006 2007 2006 2007 2006
Benefit Obligations:
Net benefit obligation at October 1, prior year .......... $13,558 $12,299 $2,992 $2,927 $551 $476
Service cost ..................................... 520 474 101 102 31 24
Interest cost ..................................... 835 726 182 170 31 26
Gross benefits paid ............................... (342) (304) (190) (158) (11) (13)
Plan participants’ contributions ...................... — — 12 13 2 2
Plan amendments ................................. 1,722 309 47 — — —
Actuarial (gain)/loss .............................. (824) 54 8 (62) (95) (5)
Foreign currency exchange rate changes .............. — — — — 46 40
Curtailments and settlements ....................... — — — — (6) (4)
Other .......................................... — — 1 — 25 5
Net benefit obligation at September 30 ................ $15,469 $13,558 $3,153 $2,992 $574 $551
Fair Value of Plan Assets:
Fair value of plan assets at October 1, prior year ........ $15,374 $12,943 $ 551 $ 509 $348 $266
Actual return on plan assets ........................ 2,445 1,310 73 50 37 36
Employer contributions ............................ 477 1,425 152 137 56 35
Plan participants’ contributions ...................... — — 12 13 2 2
Gross benefits paid ............................... (342) (304) (190) (158) (11) (13)
Acquired businesses / Other ........................ — — — — — 3
Foreign currency exchange rate changes .............. — — — — 32 23
Curtailments and settlements ....................... — — — — 6 (4)
Fair value of plan assets at September 30 .............. $17,954 $15,374 $ 598 $ 551 $470 $348
F-18