UPS 2007 Annual Report Download - page 104
Download and view the complete annual report
Please find page 104 of the 2007 UPS annual report below. You can navigate through the pages in the report by either clicking on the pages listed below, or by using the keyword search tool below to find specific information within the annual report.-
 1
1 -
2
-
3
-
4
-
5
-
6
-
7
-
8
-
9
-
10
-
11
-
12
-
13
-
14
-
15
-
16
-
17
-
18
-
19
-
20
-
21
-
22
-
23
-
24
-
25
-
26
-
27
-
28
-
29
-
30
-
31
-
32
-
33
-
34
-
35
-
36
-
37
-
38
-
39
-
40
-
41
-
42
-
43
-
44
-
45
-
46
-
47
-
48
-
49
-
50
-
51
-
52
-
53
-
54
-
55
-
56
-
57
-
58
-
59
-
60
-
61
-
62
-
63
-
64
-
65
-
66
-
67
-
68
-
69
-
70
-
71
-
72
-
73
-
74
-
75
-
76
-
77
-
78
-
79
-
80
-
81
-
82
-
83
-
84
-
85
-
86
-
87
-
88
-
89
-
90
-
91
-
92
-
93
-
 94
94 -
 95
95 -
 96
96 -
 97
97 -
 98
98 -
 99
99 -
 100
100 -
 101
101 -
 102
102 -
 103
103 -
 104
104 -
 105
105 -
 106
106 -
 107
107 -
 108
108 -
 109
109 -
 110
110 -
 111
111 -
 112
112 -
 113
113 -
 114
114 -
115
 |
 |

UNITED PARCEL SERVICE, INC. AND SUBSIDIARIES
NOTES TO CONSOLIDATED FINANCIAL STATEMENTS—(Continued)
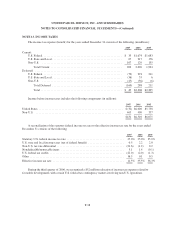
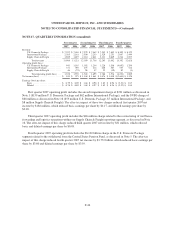
NOTE 14. EARNINGS PER SHARE
The following table sets forth the computation of basic and diluted earnings per share (in millions except per
share amounts):
2007 2006 2005
Numerator:
Net income ....................................................... $ 382 $4,202 $3,870
Denominator:
Weighted average shares ............................................ 1,055 1,082 1,110
Deferred compensation obligations ....................................233
Denominator for basic earnings per share ................................... 1,057 1,085 1,113
Effect of dilutive securities:
Restricted performance units .........................................211
Restricted stock units ............................................... 2 1 —
Stock options .....................................................222
Denominator for diluted earnings per share .................................. 1,063 1,089 1,116
Basic earnings per share ................................................. $ 0.36 $ 3.87 $ 3.48
Diluted earnings per share ............................................... $ 0.36 $ 3.86 $ 3.47
Diluted earnings per share for the years ended December 31, 2007, 2006, and 2005 exclude the effect of 8.9,
6.3, and 5.9 million shares, respectively, of common stock that may be issued upon the exercise of employee
stock options because such effect would be antidilutive.
NOTE 15. DERIVATIVE INSTRUMENTS AND RISK MANAGEMENT
We are exposed to market risk, primarily related to foreign exchange rates, commodity prices, equity prices,
and interest rates. These exposures are actively monitored by management. To manage the volatility relating to
certain of these exposures, we enter into a variety of derivative financial instruments. Our objective is to reduce,
where it is deemed appropriate to do so, fluctuations in earnings and cash flows associated with changes in
foreign currency rates, commodity prices, equity prices, and interest rates. It is our policy and practice to use
derivative financial instruments only to the extent necessary to manage exposures. As we use price sensitive
instruments to hedge a certain portion of our existing and anticipated transactions, we expect that any loss in
value for those instruments generally would be offset by increases in the value of those hedged transactions.
We do not hold or issue derivative financial instruments for trading or speculative purposes.
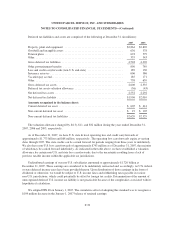
Commodity Price Risk Management
We are exposed to changes in the prices of refined fuels, principally jet-A, diesel, and unleaded gasoline.
Currently, the fuel surcharges that we apply to our domestic and international package and LTL services are the
primary means of reducing the risk of adverse fuel price changes. Additionally, we use a combination of options
contracts to provide partial protection from changing fuel and energy prices. The net fair value of such contracts
subject to price risk, excluding the underlying exposures, as of December 31, 2007 and 2006 was an asset
(liability) of $(179) and $10 million, respectively. We have designated and account for these contracts as cash
F-41