UPS 2007 Annual Report Download - page 47
Download and view the complete annual report
Please find page 47 of the 2007 UPS annual report below. You can navigate through the pages in the report by either clicking on the pages listed below, or by using the keyword search tool below to find specific information within the annual report.-
 1
1 -
2
-
3
-
4
-
5
-
6
-
7
-
8
-
9
-
10
-
11
-
12
-
13
-
14
-
15
-
16
-
17
-
18
-
19
-
20
-
21
-
22
-
23
-
24
-
25
-
26
-
27
-
28
-
29
-
30
-
31
-
32
-
33
-
34
-
35
-
36
-
 37
37 -
 38
38 -
 39
39 -
 40
40 -
 41
41 -
 42
42 -
 43
43 -
 44
44 -
 45
45 -
 46
46 -
 47
47 -
 48
48 -
 49
49 -
 50
50 -
 51
51 -
 52
52 -
 53
53 -
 54
54 -
 55
55 -
 56
56 -
 57
57 -
58
-
59
-
60
-
61
-
62
-
63
-
64
-
65
-
66
-
67
-
68
-
69
-
70
-
71
-
72
-
73
-
74
-
75
-
76
-
77
-
78
-
79
-
80
-
81
-
82
-
83
-
84
-
85
-
86
-
87
-
88
-
89
-
90
-
91
-
92
-
93
-
94
-
95
-
96
-
97
-
98
-
99
-
100
-
101
-
102
-
103
-
104
-
105
-
106
-
107
-
108
-
109
-
110
-
111
-
112
-
113
-
114
-
115
 |
 |

an increase of $0.10 in the delivery area surcharge on both residential and commercial services to certain ZIP
codes. These rate changes are customary, and are consistent with previous years’ rate increases. Additionally, we
modified the fuel surcharge on domestic and U.S.-origin international air services by reducing by 2% the index
used to determine the fuel surcharge. The UPS Ground fuel surcharge continues to fluctuate based on the U.S.
Energy Department’s On-Highway Diesel Fuel Price. Rate changes for shipments originating outside the U.S.
were made throughout the past year and varied by geographic market.
In January 2008, UPS Freight announced a general rate increase averaging 5.4 percent covering
non-contractual shipments in the United States and Canada. The increase goes into effect on February 4, 2008,
and applies to minimum charge, LTL and TL rates.
Investing Activities
Net cash used in investing activities was $2.199 billion, $2.340 billion, and $975 million in 2007, 2006, and
2005, respectively. The decrease in cash used in 2007 compared with 2006 was primarily due to lower capital
expenditures and increased net sales of marketable securities and short-term investments. Net sales of marketable
securities and short-term investments were $621 million, $482 million, and $2.752 billion in 2007, 2006, and
2005, respectively, and were primarily used to fund our pension and postretirement medical benefit plans, as well
as complete business acquisitions. In 2005, we spent $1.488 billion on business acquisitions, primarily Overnite
Corp., Lynx Express Ltd. in the United Kingdom, Messenger Service Stolica S.A. in Poland, and the express
operations of Sinotrans Air Transportation Development Co. Ltd. in China (See Note 7 to the consolidated
financial statements). We had a net cash use of $39 million in 2007, compared with cash generation of $68 and
$95 million in 2006 and 2005, respectively, due to originations, sales, and customer paydowns of finance
receivables, primarily in our commercial lending, asset-based lending, and leasing portfolios.
In the second quarter of 2006, we terminated several energy derivatives and received $229 million in cash,
which is reported in other investing activities in the statement of cash flows. These derivatives were designated
as hedges of forecasted cash outflows for purchases of fuel products. As these derivatives maintained their
effectiveness and qualified for hedge accounting, we recognized the gains associated with these hedges as a
reduction of fuel expense over the original term of the hedges through 2007.
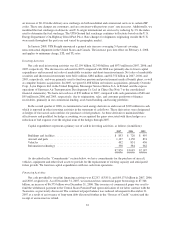
Capital expenditures represent a primary use of cash in investing activities, as follows (in millions):
2007 2006 2005
Buildings and facilities ....................................... $ 853 $ 720 $ 495
Aircraft and parts ........................................... 1,137 1,150 874
Vehicles .................................................. 492 831 456
Information technology ...................................... 338 384 362
$2,820 $3,085 $2,187
As described in the “Commitments” section below, we have commitments for the purchase of aircraft,
vehicles, equipment and other fixed assets to provide for the replacement of existing capacity and anticipated
future growth. We fund our capital expenditures with our cash from operations.
Financing Activities
Net cash provided by (used in) financing activities was $2.297, ($3.851), and ($4.175) billion in 2007, 2006,
and 2005, respectively. As of December 31, 2007, we increased our commercial paper borrowings to $7.366
billion, an increase of $6.575 billion over December 31, 2006. This issuance of commercial paper was used to
fund the withdrawal payment to the Central States Pension Fund upon ratification of our labor contract with the
Teamsters, as previously discussed. The commercial paper balance was reduced subsequent to December 31,
2007 as a result of an issuance of long-term debt (discussed further in the “Sources of Credit” section) and the
receipt of an income tax refund.
32