UPS 2007 Annual Report Download - page 38
Download and view the complete annual report
Please find page 38 of the 2007 UPS annual report below. You can navigate through the pages in the report by either clicking on the pages listed below, or by using the keyword search tool below to find specific information within the annual report.-
 1
1 -
2
-
3
-
4
-
5
-
6
-
7
-
8
-
9
-
10
-
11
-
12
-
13
-
14
-
15
-
16
-
17
-
18
-
19
-
20
-
21
-
22
-
23
-
24
-
25
-
26
-
27
-
 28
28 -
 29
29 -
 30
30 -
 31
31 -
 32
32 -
 33
33 -
 34
34 -
 35
35 -
 36
36 -
 37
37 -
 38
38 -
 39
39 -
 40
40 -
 41
41 -
 42
42 -
 43
43 -
 44
44 -
 45
45 -
 46
46 -
 47
47 -
 48
48 -
49
-
50
-
51
-
52
-
53
-
54
-
55
-
56
-
57
-
58
-
59
-
60
-
61
-
62
-
63
-
64
-
65
-
66
-
67
-
68
-
69
-
70
-
71
-
72
-
73
-
74
-
75
-
76
-
77
-
78
-
79
-
80
-
81
-
82
-
83
-
84
-
85
-
86
-
87
-
88
-
89
-
90
-
91
-
92
-
93
-
94
-
95
-
96
-
97
-
98
-
99
-
100
-
101
-
102
-
103
-
104
-
105
-
106
-
107
-
108
-
109
-
110
-
111
-
112
-
113
-
114
-
115
 |
 |

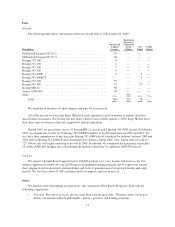
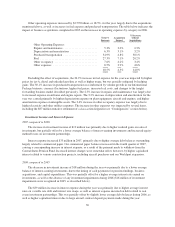
The following table sets forth information showing the operating margin for each reporting segment:
Year Ended December 31,
2007 2006 2005
Reporting Segment
U.S. Domestic Package .......................................... (4.9)% 16.2% 15.7%
International Package ............................................ 17.8% 18.8% 18.7%
Supply Chain & Freight .......................................... 3.3% 0.0% 2.6%
Consolidated Operating Margin ................................ 1.2% 14.0% 14.4%
U.S. Domestic Package Operations
2007 compared to 2006
U.S. Domestic Package revenue increased $529 million, or 1.7%, in 2007, due to a 1.6% improvement in
revenue per piece and a 0.4% increase in average daily package volume. Next Day Air volume increased 0.8% and
Ground volume increased 0.6% for the year, largely as a result of a solid peak season in the fourth quarter, when
our Next Day Air volume rose 2.2% and Ground volume increased 1.5%. Deferred air volume declined 1.9% in
2007. Our domestic air and ground products have been impacted by the slowing U.S. economy and weak small
package market in 2007. Trends in U.S. industrial production and business-to-consumer shipments in 2007 have
not been favorable to the overall small package market, which places pressure on our domestic package volume.
The increase in overall revenue per piece of 1.6% in 2007 resulted primarily from a rate increase that took
effect earlier in the year, but was negatively impacted by lower fuel surcharge revenue and an unfavorable shift
in product mix. Next Day Air revenue per piece declined 0.9%, and was negatively impacted by strong growth in
our lower-yielding Next Day Air Saver products. Deferred revenue per piece increased only 0.4%. The change in
revenue per piece for all our air products was negatively impacted by a lower fuel surcharge rate (discussed
further below). Ground revenue per piece increased 2.9%, primarily due to the rate increase, but was also
impacted slightly by a higher fuel surcharge due to higher diesel fuel prices in 2007 compared with 2006. Overall
product mix reduced revenue per piece, as our premium air products suffered volume declines while our ground
volume grew 0.6%.
Consistent with the practice in previous years, a rate increase took effect on January 1, 2007. We increased
the base rates 6.9% on UPS Next Day Air, UPS 2nd Day Air, and UPS 3 Day Select, and 4.9% on UPS Ground.
Other pricing changes included a $0.10 increase in the residential surcharge, and a $0.75 increase in the charge
for undeliverable packages after three delivery attempts.
In January 2007, we modified the fuel surcharge on domestic air services by reducing the index used to
determine the fuel surcharge by 2%. This fuel surcharge continues to be based on the U.S. Energy Department’s
Gulf Coast spot price for a gallon of kerosene-type jet fuel. Based on published rates, the average fuel surcharge
on domestic air products was 12.17% in 2007, a decline from the 14.02% in 2006, primarily due to the 2%
reduction in the index. The ground fuel surcharge rate continues to fluctuate based on the U.S. Energy
Department’s On-Highway Diesel Fuel Price. Based on published rates, the average fuel surcharge on domestic
ground products was 4.30% in 2007, an increase from 4.13% in 2006, due to higher diesel fuel prices. As a result
of the air products index rate reduction and fuel market price movements, total domestic fuel surcharge revenue
decreased by $110 million in 2007.
U.S. Domestic Package incurred an operating loss of $1.531 billion in 2007, compared with a $4.923 billion
operating profit in 2006, largely due to a $6.100 billion charge related to our withdrawal from the Central States,
Southeast and Southwest Areas Pension Fund (“Central States Pension Fund”). Additionally, Domestic Package
operating results were negatively impacted by low revenue growth, an aircraft impairment charge, and a special
voluntary separation opportunity (“SVSO”) charge. The aircraft impairment and SVSO charges reduced domestic
operating profit by $159 million and $53 million, respectively. These factors were partially offset by cost controls,
including, among other categories, lower self-insurance expense. The expense associated with our self-insurance
23