UPS 2007 Annual Report Download - page 76
Download and view the complete annual report
Please find page 76 of the 2007 UPS annual report below. You can navigate through the pages in the report by either clicking on the pages listed below, or by using the keyword search tool below to find specific information within the annual report.-
 1
1 -
2
-
3
-
4
-
5
-
6
-
7
-
8
-
9
-
10
-
11
-
12
-
13
-
14
-
15
-
16
-
17
-
18
-
19
-
20
-
21
-
22
-
23
-
24
-
25
-
26
-
27
-
28
-
29
-
30
-
31
-
32
-
33
-
34
-
35
-
36
-
37
-
38
-
39
-
40
-
41
-
42
-
43
-
44
-
45
-
46
-
47
-
48
-
49
-
50
-
51
-
52
-
53
-
54
-
55
-
56
-
57
-
58
-
59
-
60
-
61
-
62
-
63
-
64
-
65
-
 66
66 -
 67
67 -
 68
68 -
 69
69 -
 70
70 -
 71
71 -
 72
72 -
 73
73 -
 74
74 -
 75
75 -
 76
76 -
 77
77 -
 78
78 -
 79
79 -
 80
80 -
 81
81 -
 82
82 -
 83
83 -
 84
84 -
 85
85 -
 86
86 -
87
-
88
-
89
-
90
-
91
-
92
-
93
-
94
-
95
-
96
-
97
-
98
-
99
-
100
-
101
-
102
-
103
-
104
-
105
-
106
-
107
-
108
-
109
-
110
-
111
-
112
-
113
-
114
-
115
 |
 |

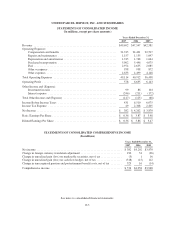
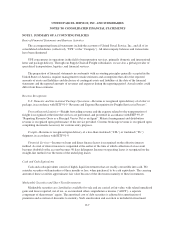
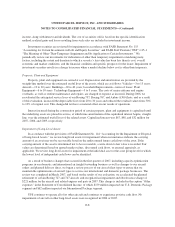
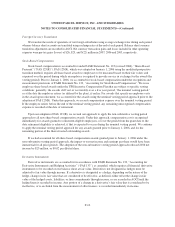
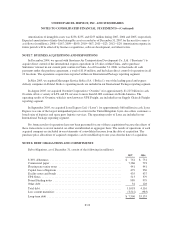
UNITED PARCEL SERVICE, INC. AND SUBSIDIARIES
NOTES TO CONSOLIDATED FINANCIAL STATEMENTS—(Continued)
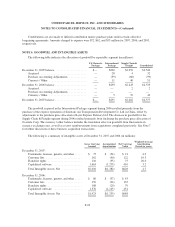
Cost
Unrealized
Gains
Unrealized
Losses
Estimated
Fair Value
2006
U.S. government and agency securities ........................ $ 124 $— $— $ 124
U.S. mortgage and asset-backed securities ..................... 234 1 2 233
U.S. corporate securities ................................... 79 — 1 78
U.S. state and local municipal securities ....................... 582 — — 582
Other debt securities ...................................... 2 — — 2
Total debt securities ................................... 1,021 1 3 1,019
Common equity securities .................................. 38 10 — 48
Preferred equity securities .................................. 122 — — 122
Current marketable securities and short-term investments ......... 1,181 11 3 1,189
Non-current common equity securities ........................ 24 8 — 32
Total marketable securities and short-term investments ........... $1,205 $ 19 $ 3 $1,221
The gross realized gains on sales of marketable securities totaled $23, $12, and $2 million in 2007, 2006,
and 2005, respectively. The gross realized losses totaled $9, $21, and $12 million in 2007, 2006, and 2005,
respectively. Impairment losses recognized on marketable securities and short-term investments totaled $16
million during 2005, with no such losses recognized in 2007 or 2006.
The following table presents the age of gross unrealized losses and fair value by investment category for all
securities in a loss position as of December 31, 2007 (in millions):
Less Than 12 Months 12 Months or More Total
Fair
Value
Unrealized
Losses
Fair
Value
Unrealized
Losses
Fair
Value
Unrealized
Losses
U.S. government and agency securities ............ $— $— $— $— $— $—
U.S. mortgage and asset-backed securities ......... 22 — 56 2 78 2
U.S. corporate securities ....................... 15 — 12 — 27 —
U.S. state and local municipal securities ........... — — ————
Other debt securities .......................... — — ————
Total debt securities ....................... 37 — 68 2 105 2
Common equity securities ...................... — — ————
Preferred equity securities ...................... — — 2 — 2 —
$ 37 $— $ 70 $ 2 $107 $ 2
The unrealized losses in the mortgage and asset-backed securities relate to various fixed income securities,
and are primarily due to changes in market interest rates. We have both the intent and ability to hold the
securities contained in the previous table for a time necessary to recover the cost basis.
The amortized cost and estimated fair value of marketable securities and short-term investments at
December 31, 2007, by contractual maturity, are shown below (in millions). Actual maturities may differ from
contractual maturities because the issuers of the securities may have the right to prepay obligations without
prepayment penalties.
F-13