UPS 2006 Annual Report Download - page 99
Download and view the complete annual report
Please find page 99 of the 2006 UPS annual report below. You can navigate through the pages in the report by either clicking on the pages listed below, or by using the keyword search tool below to find specific information within the annual report.-
 1
1 -
2
-
3
-
4
-
5
-
6
-
7
-
8
-
9
-
10
-
11
-
12
-
13
-
14
-
15
-
16
-
17
-
18
-
19
-
20
-
21
-
22
-
23
-
24
-
25
-
26
-
27
-
28
-
29
-
30
-
31
-
32
-
33
-
34
-
35
-
36
-
37
-
38
-
39
-
40
-
41
-
42
-
43
-
44
-
45
-
46
-
47
-
48
-
49
-
50
-
51
-
52
-
53
-
54
-
55
-
56
-
57
-
58
-
59
-
60
-
61
-
62
-
63
-
64
-
65
-
66
-
67
-
68
-
69
-
70
-
71
-
72
-
73
-
74
-
75
-
76
-
77
-
78
-
79
-
80
-
81
-
82
-
83
-
84
-
85
-
86
-
87
-
88
-
 89
89 -
 90
90 -
 91
91 -
 92
92 -
 93
93 -
 94
94 -
 95
95 -
 96
96 -
 97
97 -
 98
98 -
 99
99 -
 100
100 -
 101
101 -
 102
102 -
 103
103 -
 104
104 -
 105
105 -
 106
106 -
 107
107 -
 108
108 -
 109
109 -
110
-
111
 |
 |

UNITED PARCEL SERVICE, INC. AND SUBSIDIARIES
NOTES TO CONSOLIDATED FINANCIAL STATEMENTS—(Continued)
Revenue, for geographic disclosure, is based on the location in which service originates. Long-lived assets
include property, plant and equipment, pension and postretirement benefit assets, long-term investments,
goodwill, and intangible assets.
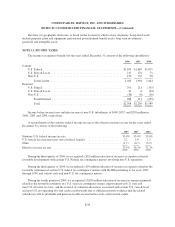
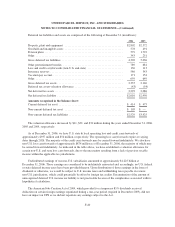
NOTE 13. INCOME TAXES
The income tax expense (benefit) for the years ended December 31 consists of the following (in millions):
2006 2005 2004
Current:
U.S. Federal ...................................................... $1,674 $1,683 $1,675
U.S. State & Local ................................................. 217 176 71
Non-U.S.......................................................... 129 135 98
Total Current ................................................. 2,020 1,994 1,844
Deferred:
U.S. Federal ...................................................... 291 211 (155)
U.S. State & Local ................................................. 33 6 (84)
Non-U.S.......................................................... (36) (6) (16)
Total Deferred ................................................ 288 211 (255)
Total ........................................................ $2,308 $2,205 $1,589
Income before income taxes includes income of non-U.S. subsidiaries of $490, $337, and $270 million in
2006, 2005, and 2004, respectively.
A reconciliation of the statutory federal income tax rate to the effective income tax rate for the years ended
December 31 consists of the following:
2006 2005 2004
Statutory U.S. federal income tax rate .................................... 35.0% 35.0% 35.0%
U.S. state & local income taxes (net of federal benefit) ....................... 2.2 2.0 1.2
Other .............................................................. (1.7) (0.7) (3.9)
Effective income tax rate .............................................. 35.5% 36.3% 32.3%
During the third quarter of 2006, we recognized a $52 million reduction of income tax expense related to
favorable developments with certain U.S. Federal tax contingency matters involving non-U.S. operations.
During the third quarter of 2004, we recognized a $99 million reduction of income tax expense related to the
favorable settlement of various U.S. federal tax contingency matters with the IRS pertaining to tax years 1985
through 1998, and various state and non-U.S. tax contingency matters.
During the fourth quarter of 2004, we recognized a $109 million reduction of income tax expense primarily
related to the favorable resolution of a U.S. state tax contingency matter, improvements in U.S. state and
non-U.S. effective tax rates, and the reversal of valuation allowances associated with certain U.S. state & local
and non-U.S. net operating loss and credit carryforwards due to sufficient positive evidence that the related
subsidiaries will be profitable and generate taxable income before such carryforwards expire.
F-39