UPS 2006 Annual Report Download - page 67
Download and view the complete annual report
Please find page 67 of the 2006 UPS annual report below. You can navigate through the pages in the report by either clicking on the pages listed below, or by using the keyword search tool below to find specific information within the annual report.-
 1
1 -
2
-
3
-
4
-
5
-
6
-
7
-
8
-
9
-
10
-
11
-
12
-
13
-
14
-
15
-
16
-
17
-
18
-
19
-
20
-
21
-
22
-
23
-
24
-
25
-
26
-
27
-
28
-
29
-
30
-
31
-
32
-
33
-
34
-
35
-
36
-
37
-
38
-
39
-
40
-
41
-
42
-
43
-
44
-
45
-
46
-
47
-
48
-
49
-
50
-
51
-
52
-
53
-
54
-
55
-
56
-
 57
57 -
 58
58 -
 59
59 -
 60
60 -
 61
61 -
 62
62 -
 63
63 -
 64
64 -
 65
65 -
 66
66 -
 67
67 -
 68
68 -
 69
69 -
 70
70 -
 71
71 -
 72
72 -
 73
73 -
 74
74 -
 75
75 -
 76
76 -
 77
77 -
78
-
79
-
80
-
81
-
82
-
83
-
84
-
85
-
86
-
87
-
88
-
89
-
90
-
91
-
92
-
93
-
94
-
95
-
96
-
97
-
98
-
99
-
100
-
101
-
102
-
103
-
104
-
105
-
106
-
107
-
108
-
109
-
110
-
111
 |
 |

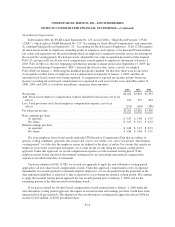
UNITED PARCEL SERVICE, INC. AND SUBSIDIARIES
STATEMENTS OF CONSOLIDATED INCOME
(In millions, except per share amounts)
Years Ended December 31,
2006 2005 2004
Revenue .......................................................... $47,547 $42,581 $36,582
Operating Expenses:
Compensation and benefits ....................................... 24,421 22,517 20,823
Repairs and maintenance ......................................... 1,155 1,097 1,005
Depreciation and amortization ..................................... 1,748 1,644 1,543
Purchased transportation ......................................... 5,496 4,075 2,084
Fuel .......................................................... 2,655 2,085 1,416
Other occupancy ................................................ 938 872 752
Other expenses ................................................. 4,499 4,148 3,970
Total Operating Expenses ............................................ 40,912 36,438 31,593
Operating Profit .................................................... 6,635 6,143 4,989
Other Income and (Expense):
Investment income .............................................. 86 104 82
Interest expense ................................................ (211) (172) (149)
Total Other Income and (Expense) ..................................... (125) (68) (67)
Income Before Income Taxes ......................................... 6,510 6,075 4,922
Income Taxes ...................................................... 2,308 2,205 1,589
Net Income ........................................................ $ 4,202 $ 3,870 $ 3,333
Basic Earnings Per Share ............................................. $ 3.87 $ 3.48 $ 2.95
Diluted Earnings Per Share ........................................... $ 3.86 $ 3.47 $ 2.93
STATEMENTS OF CONSOLIDATED COMPREHENSIVE INCOME
(In millions)
Years Ended December 31,
2006 2005 2004
Net income ........................................................... $4,202 $3,870 $3,333
Change in foreign currency translation adjustment ............................ 54 (36) (71)
Change in unrealized gain (loss) on marketable securities, net of tax .............. 1 16 (19)
Change in unrealized gain (loss) on cash flow hedges, net of tax ................. (15) 112 43
Change in minimum pension liability, net of tax .............................. 16 (14) (18)
Comprehensive income ................................................. $4,258 $3,948 $3,268
See notes to consolidated financial statements.
F-7