UPS 2006 Annual Report Download - page 75
Download and view the complete annual report
Please find page 75 of the 2006 UPS annual report below. You can navigate through the pages in the report by either clicking on the pages listed below, or by using the keyword search tool below to find specific information within the annual report.-
 1
1 -
2
-
3
-
4
-
5
-
6
-
7
-
8
-
9
-
10
-
11
-
12
-
13
-
14
-
15
-
16
-
17
-
18
-
19
-
20
-
21
-
22
-
23
-
24
-
25
-
26
-
27
-
28
-
29
-
30
-
31
-
32
-
33
-
34
-
35
-
36
-
37
-
38
-
39
-
40
-
41
-
42
-
43
-
44
-
45
-
46
-
47
-
48
-
49
-
50
-
51
-
52
-
53
-
54
-
55
-
56
-
57
-
58
-
59
-
60
-
61
-
62
-
63
-
64
-
 65
65 -
 66
66 -
 67
67 -
 68
68 -
 69
69 -
 70
70 -
 71
71 -
 72
72 -
 73
73 -
 74
74 -
 75
75 -
 76
76 -
 77
77 -
 78
78 -
 79
79 -
 80
80 -
 81
81 -
 82
82 -
 83
83 -
 84
84 -
 85
85 -
86
-
87
-
88
-
89
-
90
-
91
-
92
-
93
-
94
-
95
-
96
-
97
-
98
-
99
-
100
-
101
-
102
-
103
-
104
-
105
-
106
-
107
-
108
-
109
-
110
-
111
 |
 |

UNITED PARCEL SERVICE, INC. AND SUBSIDIARIES
NOTES TO CONSOLIDATED FINANCIAL STATEMENTS—(Continued)
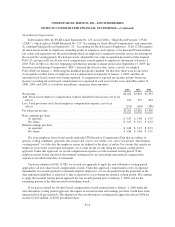
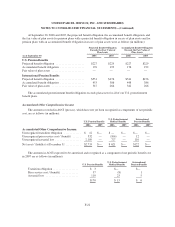
The following table presents the age of gross unrealized losses and fair value by investment category for all
securities in a loss position as of December 31, 2006 (in millions):
Less Than 12 Months 12 Months or More Total
Fair
Value
Unrealized
Losses
Fair
Value
Unrealized
Losses
Fair
Value
Unrealized
Losses
U.S. government & agency securities ............. $ 60 $— $ 20 $— $ 80 $—
U.S. mortgage & asset-backed securities ........... 74 — 76 2 150 2
U.S. corporate securities ....................... 8 — 50 1 58 1
U.S. state and local municipal securities ........... — — ————
Other debt securities .......................... — — ————
Total debt securities ....................... 142 — 146 3 288 3
Common equity securities ...................... — — ————
Preferred equity securities ...................... — — 1 — 1 —
$142 $— $147 $ 3 $289 $ 3
The unrealized losses in the U.S. government & agency securities, mortgage & asset-backed securities, and
corporate securities relate to various fixed income securities, and are primarily due to changes in market interest
rates. We have both the intent and ability to hold the securities contained in the previous table for a time
necessary to recover the cost basis.
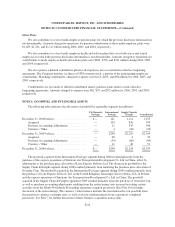
The amortized cost and estimated fair value of marketable securities and short-term investments at
December 31, 2006, by contractual maturity, are shown below (in millions). Actual maturities may differ from
contractual maturities because the issuers of the securities may have the right to prepay obligations without
prepayment penalties.
Cost
Estimated
Fair Value
Due in one year or less ............................................. $ 32 $ 32
Due after one year through three years ................................. 140 140
Due after three years through five years ................................ 22 22
Due after five years ................................................ 827 825
1,021 1,019
Equity securities .................................................. 184 202
$1,205 $1,221
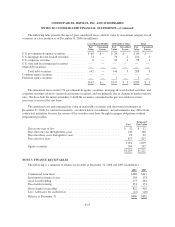
NOTE 3. FINANCE RECEIVABLES
The following is a summary of finance receivables at December 31, 2006 and 2005 (in millions):
2006 2005
Commercial term loans .................................................. $280 $317
Investment in finance leases .............................................. 138 153
Asset-basedlending..................................................... 273 281
Receivable factoring .................................................... 131 151
Gross finance receivables ................................................ 822 902
Less: Allowance for credit losses .......................................... (22) (20)
Balance at December 31 ................................................. $800 $882
F-15