UPS 2006 Annual Report Download - page 74
Download and view the complete annual report
Please find page 74 of the 2006 UPS annual report below. You can navigate through the pages in the report by either clicking on the pages listed below, or by using the keyword search tool below to find specific information within the annual report.-
 1
1 -
2
-
3
-
4
-
5
-
6
-
7
-
8
-
9
-
10
-
11
-
12
-
13
-
14
-
15
-
16
-
17
-
18
-
19
-
20
-
21
-
22
-
23
-
24
-
25
-
26
-
27
-
28
-
29
-
30
-
31
-
32
-
33
-
34
-
35
-
36
-
37
-
38
-
39
-
40
-
41
-
42
-
43
-
44
-
45
-
46
-
47
-
48
-
49
-
50
-
51
-
52
-
53
-
54
-
55
-
56
-
57
-
58
-
59
-
60
-
61
-
62
-
63
-
 64
64 -
 65
65 -
 66
66 -
 67
67 -
 68
68 -
 69
69 -
 70
70 -
 71
71 -
 72
72 -
 73
73 -
 74
74 -
 75
75 -
 76
76 -
 77
77 -
 78
78 -
 79
79 -
 80
80 -
 81
81 -
 82
82 -
 83
83 -
 84
84 -
85
-
86
-
87
-
88
-
89
-
90
-
91
-
92
-
93
-
94
-
95
-
96
-
97
-
98
-
99
-
100
-
101
-
102
-
103
-
104
-
105
-
106
-
107
-
108
-
109
-
110
-
111
 |
 |

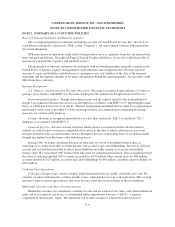
UNITED PARCEL SERVICE, INC. AND SUBSIDIARIES
NOTES TO CONSOLIDATED FINANCIAL STATEMENTS—(Continued)
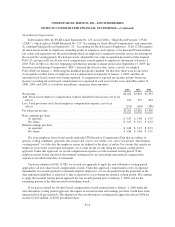
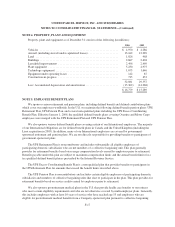
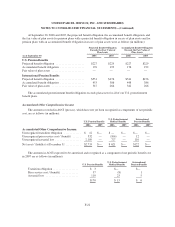
NOTE 2. MARKETABLE SECURITIES AND SHORT-TERM INVESTMENTS
The following is a summary of marketable securities and short-term investments classified as available-for-
sale at December 31, 2006 and 2005 (in millions):
Cost
Unrealized
Gains
Unrealized
Losses
Estimated
Fair Value
2006
U.S. government & agency securities ......................... $ 124 $— $— $ 124
U.S. mortgage & asset-backed securities ...................... 234 1 2 233
U.S. corporate securities ................................... 79 — 1 78
U.S. state and local municipal securities ....................... 582 — — 582
Other debt securities ...................................... 2 — — 2
Total debt securities ................................... 1,021 1 3 1,019
Common equity securities .................................. 38 10 — 48
Preferred equity securities .................................. 122 — — 122
Current marketable securities & short-term investments .......... 1,181 11 3 1,189
Non-current common equity securities ........................ 24 8 — 32
Total marketable securities & short-term investments ............ $1,205 $ 19 $ 3 $1,221
Cost
Unrealized
Gains
Unrealized
Losses
Estimated
Fair Value
2005
U.S. government & agency securities ......................... $ 400 $ 1 $ 3 $ 398
U.S. mortgage & asset-backed securities ...................... 393 1 5 389
U.S. corporate securities ................................... 425 — 4 421
U.S. state and local municipal securities ....................... 70 — — 70
Other debt securities ...................................... 2 — — 2
Total debt securities ................................... 1,290 2 12 1,280
Common equity securities .................................. 42 19 — 61
Preferred equity securities .................................. 331 — — 331
Current marketable securities & short-term investments .......... 1,663 21 12 1,672
Non-current common equity securities ........................ 21 7 — 28
Total marketable securities & short-term investments ............ $1,684 $ 28 $ 12 $1,700
The gross realized gains on sales of marketable securities totaled $12, $2, and $7 million in 2006, 2005, and
2004, respectively. The gross realized losses totaled $21, $12, and $5 million in 2006, 2005, and 2004,
respectively. Impairment losses recognized on marketable securities and short-term investments totaled $16
million during 2005, with no such losses recognized in 2006 or 2004.
F-14