UPS 2006 Annual Report Download - page 43
Download and view the complete annual report
Please find page 43 of the 2006 UPS annual report below. You can navigate through the pages in the report by either clicking on the pages listed below, or by using the keyword search tool below to find specific information within the annual report.-
 1
1 -
2
-
3
-
4
-
5
-
6
-
7
-
8
-
9
-
10
-
11
-
12
-
13
-
14
-
15
-
16
-
17
-
18
-
19
-
20
-
21
-
22
-
23
-
24
-
25
-
26
-
27
-
28
-
29
-
30
-
31
-
32
-
 33
33 -
 34
34 -
 35
35 -
 36
36 -
 37
37 -
 38
38 -
 39
39 -
 40
40 -
 41
41 -
 42
42 -
 43
43 -
 44
44 -
 45
45 -
 46
46 -
 47
47 -
 48
48 -
 49
49 -
 50
50 -
 51
51 -
 52
52 -
 53
53 -
54
-
55
-
56
-
57
-
58
-
59
-
60
-
61
-
62
-
63
-
64
-
65
-
66
-
67
-
68
-
69
-
70
-
71
-
72
-
73
-
74
-
75
-
76
-
77
-
78
-
79
-
80
-
81
-
82
-
83
-
84
-
85
-
86
-
87
-
88
-
89
-
90
-
91
-
92
-
93
-
94
-
95
-
96
-
97
-
98
-
99
-
100
-
101
-
102
-
103
-
104
-
105
-
106
-
107
-
108
-
109
-
110
-
111
 |
 |

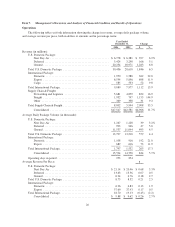
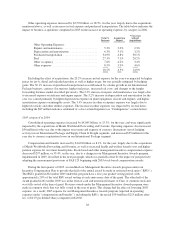
Other operating expenses increased by $2.570 billion, or 18.5%, for the year, largely due to the acquisitions
mentioned above, as well as increases in fuel expense and purchased transportation. The table below indicates the
impact of business acquisitions completed in 2005 on the increase in operating expenses by category in 2006.
Total %
Increase
Acquisition
Impact
% Increase
without
Acquisitions
Other Operating Expenses:
Repairs and maintenance . . . . . . . . . . . . . . . . . . . . . . . . 5.3% 3.0% 2.3%
Depreciation and amortization ................... 6.3% 3.1% 3.2%
Purchased transportation ........................ 34.9% 4.8% 30.1%
Fuel ........................................ 27.3% 7.1% 20.2%
Other occupancy .............................. 7.6% 4.2% 3.4%
Other expenses ............................... 8.5% 3.9% 4.6%
18.5% 4.5% 14.0%
Excluding the effect of acquisitions, the 20.2% increase in fuel expense for the year was impacted by higher
prices for jet-A, diesel and unleaded gasoline as well as higher usage, but was partially mitigated by hedging
gains. The 30.1% increase in purchased transportation was influenced by volume growth in our International
Package business, currency fluctuations, higher fuel prices, increased rail costs, and changes to the freight
forwarding business model described previously. The 2.3% increase in repairs and maintenance was largely due
to increased expense on airframe and engine repairs. The 3.2% increase in depreciation and amortization for the
year was caused primarily by higher depreciation expense on plant equipment, aircraft and engines, and higher
amortization expense on intangible assets. The 3.4% increase in other occupancy expense was largely due to
higher electricity and other utilities expenses. The increase in other expenses was impacted by several items,
including the $87 million tentative settlement of a class action litigation (see “Contingencies” section below).
2005 compared to 2004
Consolidated operating expenses increased by $4.845 billion, or 15.3%, for the year, and were significantly
impacted by the acquisitions of Menlo Worldwide Forwarding and Overnite. Operating expenses also increased
$56 million for the year due to the impact on revenue and expense of currency fluctuations (net of hedging
activity) in our International Package and Supply Chain & Freight segments, and increased $55 million for the
year due to currency repatriation losses in our International Package segment.
Compensation and benefits increased by $1.694 billion, or 8.1%, for the year, largely due to the acquisitions
of Menlo Worldwide Forwarding and Overnite, as well as increased health and welfare benefit costs and higher
pension expense for our union benefit plans. Stock-based and other management incentive compensation expense
decreased $297 million, or 33.4%, in the year, due to a change in our Management Incentive Awards program
implemented in 2005, described in the next paragraph, which was partially offset by the impact of prospectively
adopting the measurement provisions of FAS 123 beginning with 2003 stock-based compensation awards.
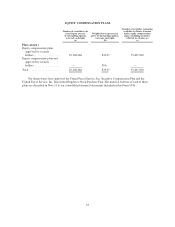
During the first quarter of 2005, we modified our Management Incentive Awards program under our
Incentive Compensation Plan to provide that half of the annual award be made in restricted stock units (“RSUs”).
The RSUs granted in November 2005 under this program have a five-year graded vesting period, with
approximately 20% of the total RSU award vesting at each anniversary date of the grant. The other half of the
award granted in November 2005 was in the form of cash and unrestricted shares of Class A common stock and
was fully vested at the time of grant. Previous awards under the Management Incentive Awards program were
made in common stock that was fully vested in the year of grant. This change had the effect of lowering 2005
expense. As a result, 2005 expense for our Management Incentive Awards program (reported in operating
expenses under “compensation and benefits”), including the RSUs, decreased $334 million ($213 million after-
tax, or $0.19 per diluted share) compared with 2004.
28