UPS 2006 Annual Report Download - page 39
Download and view the complete annual report
Please find page 39 of the 2006 UPS annual report below. You can navigate through the pages in the report by either clicking on the pages listed below, or by using the keyword search tool below to find specific information within the annual report.-
 1
1 -
2
-
3
-
4
-
5
-
6
-
7
-
8
-
9
-
10
-
11
-
12
-
13
-
14
-
15
-
16
-
17
-
18
-
19
-
20
-
21
-
22
-
23
-
24
-
25
-
26
-
27
-
28
-
 29
29 -
 30
30 -
 31
31 -
 32
32 -
 33
33 -
 34
34 -
 35
35 -
 36
36 -
 37
37 -
 38
38 -
 39
39 -
 40
40 -
 41
41 -
 42
42 -
 43
43 -
 44
44 -
 45
45 -
 46
46 -
 47
47 -
 48
48 -
 49
49 -
50
-
51
-
52
-
53
-
54
-
55
-
56
-
57
-
58
-
59
-
60
-
61
-
62
-
63
-
64
-
65
-
66
-
67
-
68
-
69
-
70
-
71
-
72
-
73
-
74
-
75
-
76
-
77
-
78
-
79
-
80
-
81
-
82
-
83
-
84
-
85
-
86
-
87
-
88
-
89
-
90
-
91
-
92
-
93
-
94
-
95
-
96
-
97
-
98
-
99
-
100
-
101
-
102
-
103
-
104
-
105
-
106
-
107
-
108
-
109
-
110
-
111
 |
 |
2005 compared to 2004
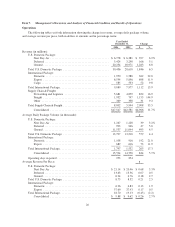
U.S. Domestic Package revenue increased $1.650 billion, or 6.1%, for the year, primarily due to a 3.4%
increase in average daily package volume and a 2.5% increase in revenue per piece. Ground volume grew 3.4%,
and was positively impacted by a solid U.S. economy and our focus on middle market sales initiatives. Next Day
Air volume grew 2.8% and deferred volume increased 4.0%, with growth in the manufacturing, business
services, telecommunications and retail sectors. The growth in total U.S. Domestic Package volume strengthened
throughout the year.
Ground revenue per piece increased 3.7% for the year, primarily due to the impact of a rate increase that
took effect in 2005, as well as the implementation of a fuel surcharge on ground products. Next Day Air revenue
per piece increased 2.0% for the year, primarily due to the rate increase and an increased fuel surcharge rate in
2005 compared to 2004. Next Day Air revenue per piece was adversely affected by relatively higher growth in
our Saver product. Both Next Day Air and deferred revenue per piece were adversely affected by lighter average
package weights.
On January 3, 2005, a rate increase took effect which was in line with previous years’ rate increases. We
increased rates 2.9% on UPS Next Day Air, UPS 2nd Day Air, UPS 3 Day Select, and UPS Ground. Other
pricing changes included an increase of $0.25 for delivery area surcharge on both residential and commercial
services to certain ZIP codes. The residential surcharge increased $0.10 for UPS Ground services and $0.35 for
UPS Next Day Air, UPS 2nd Day Air and UPS 3 Day Select.
In January 2005, we modified the fuel surcharge on domestic air services by setting a maximum cap of
9.50%, which was increased to 12.50% effective in October 2005. This fuel surcharge continued to be based on
the U.S. Energy Department’s Gulf Coast spot price for a gallon of kerosene-type jet fuel. Based on published
rates, the average fuel surcharge on domestic air products was 10.23% in 2005, as compared with 7.07% in 2004.
Additionally, an initial fuel surcharge of 2.00% was applied to UPS Ground services in January 2005, which
fluctuated based on the U.S. Energy Department’s On-Highway Diesel Fuel Price. Based on published rates, the
average fuel surcharge on domestic ground products was 2.86% in 2005. Total domestic fuel surcharge revenue
increased by $683 million for the year, due to higher jet and diesel fuel prices, volume increases, and the
modifications to our fuel surcharges noted above.
U.S. Domestic Package operating profit increased $791 million, or 21.4%, for the year, and domestic
operating margin increased by 200 basis points. Operating profit increased by $274 million due to a change in
our Management Incentive Awards program (discussed below in “Operating Expenses”), which also favorably
impacted the operating margin. The remaining increase in operating profit and margin resulted from the revenue
growth described previously, as well as controlled growth of operating expenses.
International Package Operations
2006 compared to 2005
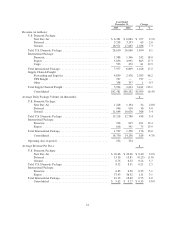
International Package revenue improved $1.112 billion, or 13.9%, for the year, primarily due to the 11.9%
volume growth for our export products and the impact of acquisitions completed in 2005. Total international
revenue per piece declined slightly for the year due to changes in product mix, as lower-yielding domestic
products comprised a larger proportion of overall international volume. The change in revenue was positively
affected by $83 million during the year due to currency fluctuations, net of hedging activity. Revenue increased
by $247 million during the year due to business acquisitions completed previously.
In January 2006, we increased rates 5.5% for international shipments originating in the United States
(Worldwide Express, Worldwide Express Plus, UPS Worldwide Expedited and UPS International Standard
service). Rate changes for international shipments originating outside the United States varied by geographical
market and occurred throughout the year.
24