UPS 2006 Annual Report Download - page 40
Download and view the complete annual report
Please find page 40 of the 2006 UPS annual report below. You can navigate through the pages in the report by either clicking on the pages listed below, or by using the keyword search tool below to find specific information within the annual report.-
 1
1 -
2
-
3
-
4
-
5
-
6
-
7
-
8
-
9
-
10
-
11
-
12
-
13
-
14
-
15
-
16
-
17
-
18
-
19
-
20
-
21
-
22
-
23
-
24
-
25
-
26
-
27
-
28
-
29
-
 30
30 -
 31
31 -
 32
32 -
 33
33 -
 34
34 -
 35
35 -
 36
36 -
 37
37 -
 38
38 -
 39
39 -
 40
40 -
 41
41 -
 42
42 -
 43
43 -
 44
44 -
 45
45 -
 46
46 -
 47
47 -
 48
48 -
 49
49 -
 50
50 -
51
-
52
-
53
-
54
-
55
-
56
-
57
-
58
-
59
-
60
-
61
-
62
-
63
-
64
-
65
-
66
-
67
-
68
-
69
-
70
-
71
-
72
-
73
-
74
-
75
-
76
-
77
-
78
-
79
-
80
-
81
-
82
-
83
-
84
-
85
-
86
-
87
-
88
-
89
-
90
-
91
-
92
-
93
-
94
-
95
-
96
-
97
-
98
-
99
-
100
-
101
-
102
-
103
-
104
-
105
-
106
-
107
-
108
-
109
-
110
-
111
 |
 |
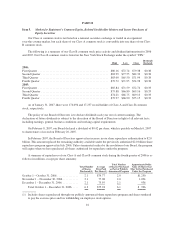
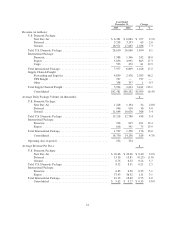
Also in January 2006, we modified the fuel surcharge on certain U.S.-related international air services by
reducing the index used to determine the fuel surcharge by 2%. The air fuel surcharge continued to remain
subject to a maximum cap of 12.5% through June 4, 2006. Effective June 5, 2006, we reduced the index by
another 2% and no longer applied a cap to the air fuel surcharge. The fuel surcharge for products originating
outside the United States continues to be indexed to fuel prices in our different international regions, depending
upon where the shipment takes place. Total international fuel surcharge revenue increased by $189 million
during the year due to higher jet fuel prices and increased international air volume.
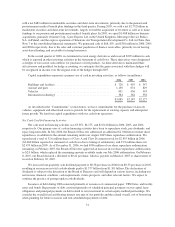
Export volume increased throughout the world, with solid volume increases in Europe, Asia, and U.S.
export products. Asian export volume continues to benefit from geographic service expansion and strong
economic growth in Asia, while European export volume gains are impacted by our growing transborder
business and the expansion of the European Union. International domestic volume increased 21.0% for the year,
due to volume growth in Canada and Europe, which also benefited from the acquisition of Stolica in Poland
during the second quarter of 2005 and the acquisition of Lynx in the U.K. during the third quarter of 2005.
Excluding the impact of acquisitions, international domestic volume and revenue increased 6.9% and 8.3%,
respectively, for the year.
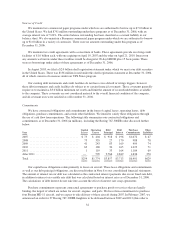
Export revenue per piece increased 0.5% for the year, largely due to the rate increases discussed previously,
the impact of the fuel surcharge, and currency fluctuations, partially offset by relatively higher growth in lower
revenue per piece transborder products. For the year, total international average daily package volume increased
17.3%, while average revenue per piece decreased 2.2% (decreased 3.3% currency-adjusted).
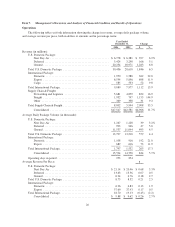
The improvement in operating profit for our International Package segment was $216 million for the year,
or 14.5%, and the operating margin increased 10 basis points to 18.8%. The increases in operating profit and
margin were driven by the volume and revenue growth described previously. The change in operating profit was
also positively affected by $26 million during the year due to currency fluctuations.
2005 compared to 2004
International Package revenue improved $1.168 billion, or 17.2%, for the year, primarily due to the 13.9%
volume growth for our export products and revenue per piece improvements. The improvements in revenue per
piece were impacted by rate changes, currency fluctuations, and the fuel surcharge applied to international
shipments. Revenue increased $121 million during the year due to currency fluctuations, net of hedging activity,
and also increased by $133 million during the year due to business acquisitions.
In January 2005, we increased rates 2.9% for international shipments originating in the United States, which
includes our Worldwide Express, Worldwide Express Plus, UPS Worldwide Expedited and UPS International
Standard services. Rate changes for international shipments originating outside the United States varied by
geographical market and occured throughout the year.
In January 2005, we modified the fuel surcharge on U.S. export products by setting a maximum cap of
9.50%, which was increased to 12.50% effective in October 2005. The fuel surcharge for products originating
outside the United States continued to be indexed to fuel prices in our different international regions, depending
upon where the shipment takes place. Total international fuel surcharge revenue increased by $246 million
during the year, due to higher jet fuel prices and increased international air volume.
Export volume increased throughout the world, with strong growth in Asia and Europe. Asian export
volume, which increased 29% for the year, was driven by export growth from China. Asian export volume
continues to benefit from our expanding international delivery network, including the additional flights from
Shanghai, China that were added in the fourth quarter of 2004, and express air service between the U.S. and
Guangzhou, China that began in the second quarter of 2005. European export volume increased 13% for the year,
while export volume from the U.S. and Americas also showed solid increases. International domestic volume
25