UPS 2006 Annual Report Download - page 44
Download and view the complete annual report
Please find page 44 of the 2006 UPS annual report below. You can navigate through the pages in the report by either clicking on the pages listed below, or by using the keyword search tool below to find specific information within the annual report.-
 1
1 -
2
-
3
-
4
-
5
-
6
-
7
-
8
-
9
-
10
-
11
-
12
-
13
-
14
-
15
-
16
-
17
-
18
-
19
-
20
-
21
-
22
-
23
-
24
-
25
-
26
-
27
-
28
-
29
-
30
-
31
-
32
-
33
-
 34
34 -
 35
35 -
 36
36 -
 37
37 -
 38
38 -
 39
39 -
 40
40 -
 41
41 -
 42
42 -
 43
43 -
 44
44 -
 45
45 -
 46
46 -
 47
47 -
 48
48 -
 49
49 -
 50
50 -
 51
51 -
 52
52 -
 53
53 -
 54
54 -
55
-
56
-
57
-
58
-
59
-
60
-
61
-
62
-
63
-
64
-
65
-
66
-
67
-
68
-
69
-
70
-
71
-
72
-
73
-
74
-
75
-
76
-
77
-
78
-
79
-
80
-
81
-
82
-
83
-
84
-
85
-
86
-
87
-
88
-
89
-
90
-
91
-
92
-
93
-
94
-
95
-
96
-
97
-
98
-
99
-
100
-
101
-
102
-
103
-
104
-
105
-
106
-
107
-
108
-
109
-
110
-
111
 |
 |
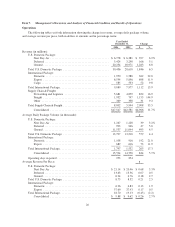
Other operating expenses increased by $3.151 billion, or 29.3%, for the year, largely due to the Menlo
Worldwide Forwarding and Overnite acquisitions, as well as increases in fuel expense and purchased
transportation. The 47.2% increase in fuel expense for the year was impacted by higher prices for jet-A, diesel
and unleaded gasoline, as well as higher fuel usage, but was partially mitigated with hedging gains. The 95.5%
increase in purchased transportation was primarily due to the Menlo Worldwide Forwarding acquisition, but was
also influenced by volume growth in our International Package business and higher fuel prices. The 9.2%
increase in repairs and maintenance was largely due to higher expense on vehicle parts (partially affected by the
Overnite acquisition), airframe and aircraft engine maintenance. The 6.5% increase in depreciation and
amortization for the year was impacted by higher depreciation expense on buildings (largely due to acquisitions),
aircraft, and capitalized software. The 16.0% increase in other occupancy expense was largely due to higher
facilities rent expense in our Supply Chain & Freight segment, which was impacted by the Menlo Worldwide
Forwarding acquisition, and increased utilities expense. The 4.5% increase in other expenses was primarily due
to the Overnite acquisition, but partially offset by the absence in 2005 of the $110 million aircraft impairment
charge that we incurred in 2004.
Investment Income and Interest Expense
2006 compared to 2005
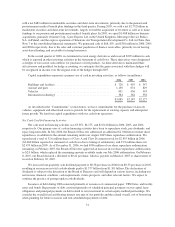
The decrease in investment income of $18 million during the year was primarily due to a lower average
balance of interest-earning investments, due to the timing of cash payments for pension fundings, business
acquisitions, and capital expenditures. This was partially offset by a higher average interest rate earned on
investments, as well as the absence of any investment impairments during 2006 ($16 million of investment
impairments were recognized in 2005, as described below).
The $39 million increase in interest expense during the year was primarily due to higher average interest
rates on variable rate debt and interest rate swaps, as well as interest expense incurred on debt related to real
estate investment partnerships. This was partially offset by slightly lower average debt balances during 2006, as
well as higher capitalized interest due to large aircraft contract deposit payments made during the year.
2005 compared to 2004
The increase in investment income of $22 million during the year was primarily due to higher average
yields earned caused by the increasing short-term interest rates in the United States, but partially offset by a
lower average balance of interest-earning investments, increased equity-method losses on certain investment
partnerships, and an investment impairment charge on certain available-for-sale securities. We periodically
review our investments for indications of other than temporary impairment considering many factors, including
the extent and duration to which a security’s fair value has been less than its cost, overall economic and market
conditions, and the financial condition and specific prospects for the issuer. After considering these factors, we
recorded an impairment charge of $16 million in the fourth quarter of 2005 related to several variable rate
preferred securities issued by the Federal National Mortgage Association (FNMA) and the Federal Home Loan
Mortgage Corporation (FHLMC).
The $23 million increase in interest expense for the year was primarily due to higher floating interest rates
on variable rate debt and interest rate swaps, as well as higher imputed interest expense associated with real
estate investment partnerships.
Net Income and Earnings Per Share
2006 compared to 2005
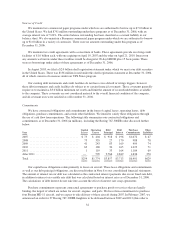
Net income for 2006 was $4.202 billion, an 8.6% increase from the $3.870 billion achieved in 2005,
resulting in a 11.2% increase in diluted earnings per share to $3.86 in 2006 from $3.47 in 2005. Net income in
2006 benefited from a $52 million reduction in income tax expense ($0.05 impact to diluted earnings per share)
29