UPS 2006 Annual Report Download - page 98
Download and view the complete annual report
Please find page 98 of the 2006 UPS annual report below. You can navigate through the pages in the report by either clicking on the pages listed below, or by using the keyword search tool below to find specific information within the annual report.-
 1
1 -
2
-
3
-
4
-
5
-
6
-
7
-
8
-
9
-
10
-
11
-
12
-
13
-
14
-
15
-
16
-
17
-
18
-
19
-
20
-
21
-
22
-
23
-
24
-
25
-
26
-
27
-
28
-
29
-
30
-
31
-
32
-
33
-
34
-
35
-
36
-
37
-
38
-
39
-
40
-
41
-
42
-
43
-
44
-
45
-
46
-
47
-
48
-
49
-
50
-
51
-
52
-
53
-
54
-
55
-
56
-
57
-
58
-
59
-
60
-
61
-
62
-
63
-
64
-
65
-
66
-
67
-
68
-
69
-
70
-
71
-
72
-
73
-
74
-
75
-
76
-
77
-
78
-
79
-
80
-
81
-
82
-
83
-
84
-
85
-
86
-
87
-
 88
88 -
 89
89 -
 90
90 -
 91
91 -
 92
92 -
 93
93 -
 94
94 -
 95
95 -
 96
96 -
 97
97 -
 98
98 -
 99
99 -
 100
100 -
 101
101 -
 102
102 -
 103
103 -
 104
104 -
 105
105 -
 106
106 -
 107
107 -
 108
108 -
109
-
110
-
111
 |
 |

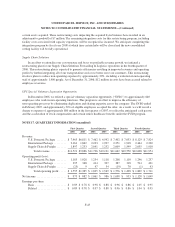
UNITED PARCEL SERVICE, INC. AND SUBSIDIARIES
NOTES TO CONSOLIDATED FINANCIAL STATEMENTS—(Continued)
2006 2005 2004
Assets:
U.S. Domestic Package .......................................... $19,274 $20,572 $18,749
International Package ............................................ 5,496 4,931 4,682
Supply Chain & Freight .......................................... 7,150 7,116 4,878
Unallocated.................................................... 1,290 2,328 4,538
Consolidated ............................................... $33,210 $34,947 $32,847
Depreciation and Amortization Expense:
U.S. Domestic Package .......................................... $ 989 $ 1,005 $ 971
International Package ............................................ 547 491 465
Supply Chain & Freight .......................................... 212 148 107
Consolidated ............................................... $ 1,748 $ 1,644 $ 1,543
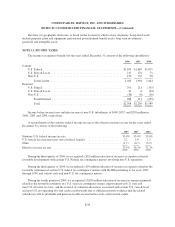
Revenue by product type for the years ended December 31 is as follows (in millions):
2006 2005 2004
U.S. Domestic Package:
NextDayAir .................................................. $ 6,778 $ 6,381 $ 6,084
Deferred ...................................................... 3,424 3,258 3,193
Ground ....................................................... 20,254 18,971 17,683
Total U.S. Domestic Package . . . . . . . . . . . . . . . . . . . . . . . . . . . . . . . . . . . . . . . . . . 30,456 28,610 26,960
International Package:
Domestic...................................................... 1,950 1,588 1,346
Export ........................................................ 6,554 5,856 4,991
Cargo ........................................................ 585 533 472
Total International Package ........................................... 9,089 7,977 6,809
Supply Chain & Freight:
Forwarding and Logistics ......................................... 5,681 4,859 2,476
Freight ....................................................... 1,952 797 —
Other ......................................................... 369 338 337
Total Supply Chain & Freight ......................................... 8,002 5,994 2,813
Consolidated ................................................... $47,547 $42,581 $36,582
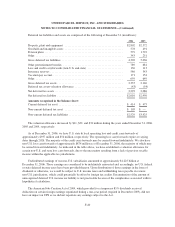
Geographic information as of, and for the years ended, December 31 is as follows (in millions):
2006 2005 2004
United States:
Revenue ...................................................... $34,445 $31,871 $28,035
Long-lived assets ............................................... $18,659 $19,704 $16,033
International:
Revenue ...................................................... $13,102 $10,710 $ 8,547
Long-lived assets ............................................... $ 4,800 $ 4,044 $ 3,975
Consolidated:
Revenue ...................................................... $47,547 $42,581 $36,582
Long-lived assets ............................................... $23,459 $23,748 $20,008
F-38