UPS 2006 Annual Report Download - page 37
Download and view the complete annual report
Please find page 37 of the 2006 UPS annual report below. You can navigate through the pages in the report by either clicking on the pages listed below, or by using the keyword search tool below to find specific information within the annual report.-
 1
1 -
2
-
3
-
4
-
5
-
6
-
7
-
8
-
9
-
10
-
11
-
12
-
13
-
14
-
15
-
16
-
17
-
18
-
19
-
20
-
21
-
22
-
23
-
24
-
25
-
26
-
 27
27 -
 28
28 -
 29
29 -
 30
30 -
 31
31 -
 32
32 -
 33
33 -
 34
34 -
 35
35 -
 36
36 -
 37
37 -
 38
38 -
 39
39 -
 40
40 -
 41
41 -
 42
42 -
 43
43 -
 44
44 -
 45
45 -
 46
46 -
 47
47 -
48
-
49
-
50
-
51
-
52
-
53
-
54
-
55
-
56
-
57
-
58
-
59
-
60
-
61
-
62
-
63
-
64
-
65
-
66
-
67
-
68
-
69
-
70
-
71
-
72
-
73
-
74
-
75
-
76
-
77
-
78
-
79
-
80
-
81
-
82
-
83
-
84
-
85
-
86
-
87
-
88
-
89
-
90
-
91
-
92
-
93
-
94
-
95
-
96
-
97
-
98
-
99
-
100
-
101
-
102
-
103
-
104
-
105
-
106
-
107
-
108
-
109
-
110
-
111
 |
 |

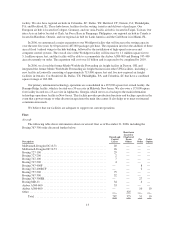
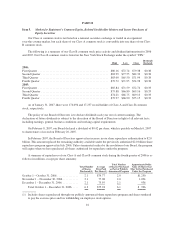
The following table sets forth information showing the change in UPS Freight’s less-than-truckload
revenue, shipments, and weight hauled, both in dollars or amounts and in percentage terms:
Year Ended
December 31, Change
2006 2005 $ %
LTLrevenue(inmillions)........................... $1,831 $ 754 $1,077 142.8%
LTL revenue per LTL hundredweight ................. $ 15.93 $15.53 $ 0.40 2.6%
LTL shipments (in thousands) ....................... 9,638 4,113 5,525 134.3%
LTL shipments per day (in thousands) ................. 38 41 (3) (7.3)%
LTL gross weight hauled (in millions of pounds) ........ 11,498 4,855 6,643 136.8%
LTL weight per shipment ........................... 1,193 1,180 13 1.1%
Operating days in period ............................ 252 101
Overnite Corp., now known as UPS Freight, was acquired on August 5, 2005. The information presented
above reflects the performance of UPS Freight for the period subsequent to the date of acquisition.
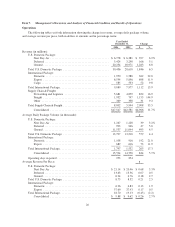
Operating Profit and Operating Margin
The following tables set forth information showing the change in operating profit, both in dollars (in
millions) and in percentage terms, as well as the operating margin for each reporting segment:
Year Ended
December 31, Change
2006 2005 $ %
Reporting Segment
U.S. Domestic Package ............................... $4,923 $4,493 $ 430 9.6%
International Package ................................. 1,710 1,494 216 14.5
Supply Chain & Freight ............................... 2 156 (154) (98.7)
Consolidated Operating Profit ...................... $6,635 $6,143 $ 492 8.0%
Year Ended
December 31, Change
2005 2004 $ %
Reporting Segment
U.S. Domestic Package ............................... $4,493 $3,702 $ 791 21.4%
International Package ................................. 1,494 1,149 345 30.0
Supply Chain & Freight ............................... 156 138 18 13.0
Consolidated Operating Profit ...................... $6,143 $4,989 $1,154 23.1%
Year Ended December 31,
2006 2005 2004
Reporting Segment
U.S. Domestic Package ........................................ 16.2% 15.7% 13.7%
International Package ......................................... 18.8% 18.7% 16.9%
Supply Chain & Freight ....................................... 0.0% 2.6% 4.9%
Consolidated Operating Margin ............................. 14.0% 14.4% 13.6%
22