UPS 2006 Annual Report Download - page 36
Download and view the complete annual report
Please find page 36 of the 2006 UPS annual report below. You can navigate through the pages in the report by either clicking on the pages listed below, or by using the keyword search tool below to find specific information within the annual report.-
 1
1 -
2
-
3
-
4
-
5
-
6
-
7
-
8
-
9
-
10
-
11
-
12
-
13
-
14
-
15
-
16
-
17
-
18
-
19
-
20
-
21
-
22
-
23
-
24
-
25
-
 26
26 -
 27
27 -
 28
28 -
 29
29 -
 30
30 -
 31
31 -
 32
32 -
 33
33 -
 34
34 -
 35
35 -
 36
36 -
 37
37 -
 38
38 -
 39
39 -
 40
40 -
 41
41 -
 42
42 -
 43
43 -
 44
44 -
 45
45 -
 46
46 -
47
-
48
-
49
-
50
-
51
-
52
-
53
-
54
-
55
-
56
-
57
-
58
-
59
-
60
-
61
-
62
-
63
-
64
-
65
-
66
-
67
-
68
-
69
-
70
-
71
-
72
-
73
-
74
-
75
-
76
-
77
-
78
-
79
-
80
-
81
-
82
-
83
-
84
-
85
-
86
-
87
-
88
-
89
-
90
-
91
-
92
-
93
-
94
-
95
-
96
-
97
-
98
-
99
-
100
-
101
-
102
-
103
-
104
-
105
-
106
-
107
-
108
-
109
-
110
-
111
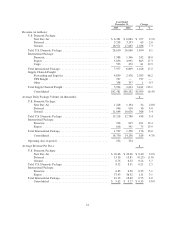
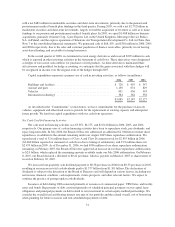
 |
 |

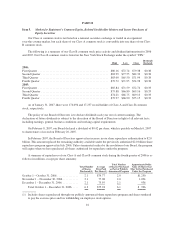
Year Ended
December 31, Change
2005 2004 $ %
Revenue (in millions):
U.S. Domestic Package:
NextDayAir ......................................... $ 6,381 $ 6,084 $ 297 4.9%
Deferred ............................................. 3,258 3,193 65 2.0
Ground .............................................. 18,971 17,683 1,288 7.3
Total U.S. Domestic Package ................................ 28,610 26,960 1,650 6.1
International Package:
Domestic ............................................ 1,588 1,346 242 18.0
Export .............................................. 5,856 4,991 865 17.3
Cargo ............................................... 533 472 61 12.9
Total International Package . . . . . . . . . . . . . . . . . . . . . . . . . . . . . . . . . . 7,977 6,809 1,168 17.2
Supply Chain & Freight:
Forwarding and Logistics ............................... 4,859 2,476 2,383 96.2
UPS Freight .......................................... 797 — 797 —
Other ............................................... 338 337 1 0.3
Total Supply Chain & Freight ................................ 5,994 2,813 3,181 113.1
Consolidated ......................................... $42,581 $36,582 $5,999 16.4%
Average Daily Package Volume (in thousands): #
U.S. Domestic Package:
NextDayAir ......................................... 1,228 1,194 34 2.8%
Deferred ............................................. 946 910 36 4.0
Ground .............................................. 11,044 10,676 368 3.4
Total U.S. Domestic Package ................................ 13,218 12,780 438 3.4
International Package:
Domestic ............................................ 916 815 101 12.4
Export .............................................. 616 541 75 13.9
Total International Package . . . . . . . . . . . . . . . . . . . . . . . . . . . . . . . . . . 1,532 1,356 176 13.0
Consolidated ......................................... 14,750 14,136 614 4.3%
Operating days in period .................................... 254 254
Average Revenue Per Piece: $
U.S. Domestic Package:
NextDayAir ......................................... $ 20.46 $ 20.06 $ 0.40 2.0%
Deferred ............................................. 13.56 13.81 (0.25) (1.8)
Ground .............................................. 6.76 6.52 0.24 3.7
Total U.S. Domestic Package ................................ 8.52 8.31 0.21 2.5
International Package:
Domestic ............................................ 6.83 6.50 0.33 5.1
Export .............................................. 37.43 36.32 1.11 3.1
Total International Package . . . . . . . . . . . . . . . . . . . . . . . . . . . . . . . . . . 19.13 18.40 0.73 4.0
Consolidated ......................................... $ 9.62 $ 9.27 $ 0.35 3.8%
21