UPS 2006 Annual Report Download - page 34
Download and view the complete annual report
Please find page 34 of the 2006 UPS annual report below. You can navigate through the pages in the report by either clicking on the pages listed below, or by using the keyword search tool below to find specific information within the annual report.-
 1
1 -
2
-
3
-
4
-
5
-
6
-
7
-
8
-
9
-
10
-
11
-
12
-
13
-
14
-
15
-
16
-
17
-
18
-
19
-
20
-
21
-
22
-
23
-
 24
24 -
 25
25 -
 26
26 -
 27
27 -
 28
28 -
 29
29 -
 30
30 -
 31
31 -
 32
32 -
 33
33 -
 34
34 -
 35
35 -
 36
36 -
 37
37 -
 38
38 -
 39
39 -
 40
40 -
 41
41 -
 42
42 -
 43
43 -
 44
44 -
45
-
46
-
47
-
48
-
49
-
50
-
51
-
52
-
53
-
54
-
55
-
56
-
57
-
58
-
59
-
60
-
61
-
62
-
63
-
64
-
65
-
66
-
67
-
68
-
69
-
70
-
71
-
72
-
73
-
74
-
75
-
76
-
77
-
78
-
79
-
80
-
81
-
82
-
83
-
84
-
85
-
86
-
87
-
88
-
89
-
90
-
91
-
92
-
93
-
94
-
95
-
96
-
97
-
98
-
99
-
100
-
101
-
102
-
103
-
104
-
105
-
106
-
107
-
108
-
109
-
110
-
111
 |
 |

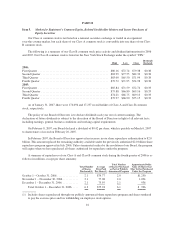
Item 6. Selected Financial Data
The following table sets forth selected financial data for each of the five years in the period ended
December 31, 2006 (amounts in millions, except per share amounts). This financial data should be read together
with our consolidated financial statements and related notes, Management’s Discussion and Analysis of Financial
Condition and Results of Operations, and other financial data appearing elsewhere in this report.
Years Ended December 31,
2006 2005 2004 2003 2002
Selected Income Statement Data
Revenue:
U.S. Domestic Package ......................... $30,456 $28,610 $26,960 $25,362 $24,280
International Package ........................... 9,089 7,977 6,809 5,609 4,720
Supply Chain & Freight ......................... 8,002 5,994 2,813 2,514 2,272
Total revenue ................................. 47,547 42,581 36,582 33,485 31,272
Operating expenses:
Compensation and benefits ...................... 24,421 22,517 20,823 19,251 17,849
Other ........................................ 16,491 13,921 10,770 9,789 9,327
Total operating expenses ........................ 40,912 36,438 31,593 29,040 27,176
Operating profit (loss):
U.S. Domestic Package ......................... 4,923 4,493 3,702 3,657 3,925
International Package ........................... 1,710 1,494 1,149 732 338
SupplyChainandFreight........................ 2 156 138 56 (167)
Total operating profit ........................... 6,635 6,143 4,989 4,445 4,096
Other income (expense):
Investment income ............................. 86 104 82 18 63
Interest expense ............................... (211) (172) (149) (121) (173)
Gain on redemption of long-term debt .............. — — — 28 —
Reversal of tax assessment ....................... ————1,023
Income before income taxes . . . . . . . . . . . . . . . . . . . . . . . . . . 6,510 6,075 4,922 4,370 5,009
Income taxes . . . . . . . . . . . . . . . . . . . . . . . . . . . . . . . . . . . . . . (2,308) (2,205) (1,589) (1,472) (1,755)
Cumulative effect of change in accounting principle ...... ———— (72)
Net income ....................................... $ 4,202 $ 3,870 $ 3,333 $ 2,898 $ 3,182
Per share amounts:
Basic earnings per share ......................... $ 3.87 $ 3.48 $ 2.95 $ 2.57 $ 2.84
Diluted earnings per share ....................... $ 3.86 $ 3.47 $ 2.93 $ 2.55 $ 2.81
Dividends declared per share ..................... $ 1.52 $ 1.32 $ 1.12 $ 0.92 $ 0.76
Weighted average shares outstanding:
Basic ........................................ 1,085 1,113 1,129 1,128 1,120
Diluted ...................................... 1,089 1,116 1,137 1,138 1,134
As of December 31,
2006 2005 2004 2003 2002
Selected Balance Sheet Data
Cash and marketable securities ....................... $ 1,983 $ 3,041 $ 5,197 $ 3,952 $ 3,014
Total assets ....................................... 33,210 34,947 32,847 29,734 26,868
Long-term debt .................................... 3,133 3,159 3,261 3,149 3,495
Shareowners’ equity ................................ 15,482 16,884 16,378 14,852 12,455
19