Tyson Foods 2005 Annual Report Download - page 65
Download and view the complete annual report
Please find page 65 of the 2005 Tyson Foods annual report below. You can navigate through the pages in the report by either clicking on the pages listed below, or by using the keyword search tool below to find specific information within the annual report.-
 1
1 -
2
-
3
-
4
-
5
-
6
-
7
-
8
-
9
-
10
-
11
-
12
-
13
-
14
-
15
-
16
-
17
-
18
-
19
-
20
-
21
-
22
-
23
-
24
-
25
-
26
-
27
-
28
-
29
-
30
-
31
-
32
-
33
-
34
-
35
-
36
-
37
-
38
-
39
-
40
-
41
-
42
-
43
-
44
-
45
-
46
-
47
-
48
-
49
-
50
-
51
-
52
-
53
-
54
-
 55
55 -
 56
56 -
 57
57 -
 58
58 -
 59
59 -
 60
60 -
 61
61 -
 62
62 -
 63
63 -
 64
64 -
 65
65 -
 66
66 -
 67
67 -
 68
68 -
 69
69 -
 70
70
 |
 |

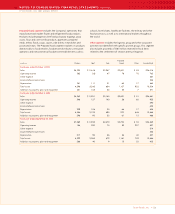
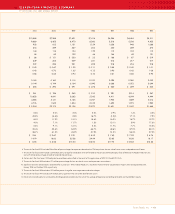
>> ELEVEN-YEAR FINANCIAL SUMMARY
TYSON FOODS, INC. 2005 ANNUAL REPORT
>>>>>>>>>>>>>>>>
>>>>>>>>>>>>>>>>
Tyson Foods, Inc. >> 63
6. The results for fiscal 2001 include $26 million of pretax charges for expenses related to the TFM acquisition, loss on sale of swine assets, and product recall losses.
7. The results for fiscal 2000 include a $24 million pretax charge for a bad debt write-off related to the January 2000 bankruptcy filing of AmeriServe Food Distribution, Inc.
and a $9 million pretax charge related to Tyson de Mexico losses.
8. Certain costs for fiscal years 1999 and prior have not been reclassified as the result of the application of EITF 00-14 and EITF 00-25.
9. The results for fiscal 1999 include a $77 million pretax charge for loss on sale of assets and impairment write-downs.
10. Significant business combinations accounted for as purchases: TFM, Hudson Foods, Inc. and Arctic Alaska Fisheries Corporation in August 2001 and September 2001,
January 1998 and October 1992, respectively.
11. The results for fiscal 1998 include a $215 million pretax charge for asset impairment and other charges.
12. The results for fiscal 1997 include a $41 million pretax gain from the sale of the beef division assets.
13. Return on invested capital is calculated by dividing operating income by the sum of the average of beginning and ending total debt and shareholders’ equity.
2001 2000 1999 1998 1997 1996 1995
$10,563 $7,268 $7,621 $7,414 $6,356 $6,454 $5,511
9,660 6,453 6,470 6,260 5,318 5,506 4,423
903 815 1,151 1,154 1,038 948 1,088
316 349 487 204 400 269 472
144 116 124 139 110 133 115
58 83 129 46 144 49 131
$ 88 $ 151 $ 230 $ 25 $ 186 $ 87 $ 219
349 225 229 231 213 217 217
222 226 231 228 218 218 218
$ 0.40 $ 0.67 $ 1.00 $ 0.11 $ 0.85 $ 0.40 $ 1.01
0.42 0.70 1.05 0.12 0.90 0.42 1.06
0.38 0.63 0.94 0.10 0.81 0.38 0.95
0.160 0.160 0.115 0.100 0.095 0.080 0.053
0.144 0.144 0.104 0.090 0.086 0.072 0.044
$ 335 $ 294 $ 291 $ 276 $ 230 $ 239 $ 205
$ 261 $ 196 $ 363 $ 310 $ 291 $214 $ 347
10,632 4,841 5,083 5,242 4,411 4,544 4,444
4,085 2,141 2,185 2,257 1,925 1,869 2,014
4,776 1,542 1,804 2,129 1,690 1,975 1,985
$ 3,354 $2,175 $2,128 $1,970 $1,621 $1,542 $1,468
0.8% 2.0% 3.0% 0.3% 2.9% 1.4% 4.0%
45.3% (4.6)% 2.8% 16.7% (1.5)% 17.1% 7.9%
8.5% 11.2% 15.1% 15.6% 16.3% 14.7% 19.7%
4.0% 7.1% 11.7% 1.5% 12.1% 5.9% 17.0%
5.3% 9.1% 12.1% 5.5% 11.7% 7.7% 15.2%
35.4% 35.6% 34.9% 64.7% 43.6% 37.0% 38.1%
58.7% 41.5% 45.9% 51.9% 51.0% 56.2% 57.5%
$ 9.61 $ 9.67 $ 9.31 $ 8.53 $ 7.60 $ 7.09 $ 6.76
14.19 18.00 25.38 24.44 23.63 18.58 18.17
$ 8.35 $ 8.56 $15.00 $16.50 $17.75 $13.83 $13.83