Tyson Foods 2005 Annual Report Download - page 64
Download and view the complete annual report
Please find page 64 of the 2005 Tyson Foods annual report below. You can navigate through the pages in the report by either clicking on the pages listed below, or by using the keyword search tool below to find specific information within the annual report.-
 1
1 -
2
-
3
-
4
-
5
-
6
-
7
-
8
-
9
-
10
-
11
-
12
-
13
-
14
-
15
-
16
-
17
-
18
-
19
-
20
-
21
-
22
-
23
-
24
-
25
-
26
-
27
-
28
-
29
-
30
-
31
-
32
-
33
-
34
-
35
-
36
-
37
-
38
-
39
-
40
-
41
-
42
-
43
-
44
-
45
-
46
-
47
-
48
-
49
-
50
-
51
-
52
-
53
-
 54
54 -
 55
55 -
 56
56 -
 57
57 -
 58
58 -
 59
59 -
 60
60 -
 61
61 -
 62
62 -
 63
63 -
 64
64 -
 65
65 -
 66
66 -
 67
67 -
 68
68 -
 69
69 -
 70
70
 |
 |

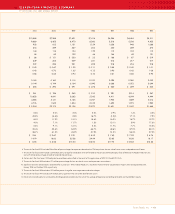
>> ELEVEN-YEAR FINANCIAL SUMMARY
TYSON FOODS, INC. 2005 ANNUAL REPORT
Tyson Foods, Inc. >> 62
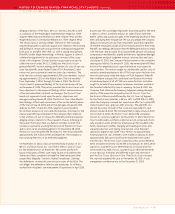
NOTES TO ELEVEN-YEAR FINANCIAL SUMMARY
1. Fiscal years 2004 and 1998 were 53-week years, while the other years presented were 52-week years.
2. The results for fiscal 2005 include $33 million of pretax charges related to a legal settlement involving the Company’s live swine operations, a non-recurring income tax net
benefit of $15 million including benefit from the reversal of certain income tax reserves, partially offset by an income tax charge related to the one-time repatriation of foreign
income under the American Jobs Creation Act, $14 million of pretax charges primarily related to closing two poultry and one prepared foods operations, $12 million of pretax
gains related to vitamin antitrust litigation settlements received, $8 million of pretax losses related to hurricane losses and an $8 million pretax gain related to the sale of the
Company’s remaining interest in Specialty Brands, Inc.
3. The results for fiscal 2004 include $61 million of pretax BSE-related charges, $40 million of pretax charges primarily related to closing one poultry and three prepared foods
operations, $25 million of pretax charges related to the impairment of intangible assets and $21 million of pretax charges related to fixed asset write-downs.
4. The results for fiscal 2003 include $167 million of pretax gains related to vitamin antitrust litigation settlements received and $76 million of pretax charges related to closing
four poultry operations.
5. The results for fiscal 2002 include a $27 million pretax charge related to the identifiable intangible asset write-down of the Thomas E. Wilson brand, $26 million pretax
charge for live swine restructuring charge, $22 million pretax gain related to the sale of Specialty Brands, Inc. and $30 million pretax gain related to vitamin antitrust litigation
settlements received.
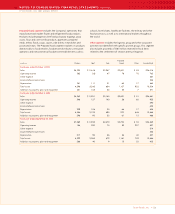
in millions, except per share and ratio data 2005 2004 2003 2002
Summary of Operations
Sales $26,014 $26,441 $24,549 $23,367
Cost of sales 24,274 24,550 22,805 21,550
Gross profit 1,740 1,891 1,744 1,817
Operating income 765 925 837 887
Interest expense 227 275 296 305
Provision for income taxes 175 232 186 210
Net income $ 353 $ 403 $ 337 $ 383
Year end shares outstanding 355 353 353 353
Diluted average shares outstanding 357 357 352 355
Diluted earnings per share $ 0.99 $ 1.13 $ 0.96 $ 1.08
Class A basic earnings per share 1.05 1.20 1.00 1.13
Class B basic earnings per share 0.95 1.08 0.90 1.02
Dividends per share:
Class A 0.160 0.160 0.160 0.160
Class B 0.144 0.144 0.144 0.144
Depreciation and amortization $ 501 $ 490 $ 458 $ 467
Balance Sheet Data
Capital expenditures $ 571 $ 486 $ 402 $ 433
Total assets 10,504 10,464 10,486 10,372
Net property, plant and equipment 4,007 3,964 4,039 4,038
Total debt 2,995 3,362 3,604 3,987
Shareholders’ equity $ 4,652 $ 4,292 $ 3,954 $ 3,662
Other Key Financial Measures
Return on sales 1.4% 1.5% 1.4% 1.6%
Annual sales growth (decline) (1.6)% 7.7% 5.1% 121.2%
Gross margin 6.7% 7.2% 7.1% 7.8%
Return on beginning shareholders’ equity 8.2% 10.2% 9.2% 11.4%
Return on invested capital 10.0% 12.2% 11.0% 11.2%
Effective tax rate 33.1% 36.6% 35.5% 35.5%
Total debt to capitalization 39.2% 43.9% 47.7% 52.1%
Book value per share $ 13.13 $ 12.19 $ 11.21 $ 10.37
Closing stock price high 19.47 21.06 14.42 15.56
Closing stock price low $ 14.12 $ 12.59 $ 7.28 $ 8.75