Tyson Foods 2005 Annual Report Download - page 55
Download and view the complete annual report
Please find page 55 of the 2005 Tyson Foods annual report below. You can navigate through the pages in the report by either clicking on the pages listed below, or by using the keyword search tool below to find specific information within the annual report.-
 1
1 -
2
-
3
-
4
-
5
-
6
-
7
-
8
-
9
-
10
-
11
-
12
-
13
-
14
-
15
-
16
-
17
-
18
-
19
-
20
-
21
-
22
-
23
-
24
-
25
-
26
-
27
-
28
-
29
-
30
-
31
-
32
-
33
-
34
-
35
-
36
-
37
-
38
-
39
-
40
-
41
-
42
-
43
-
44
-
 45
45 -
 46
46 -
 47
47 -
 48
48 -
 49
49 -
 50
50 -
 51
51 -
 52
52 -
 53
53 -
 54
54 -
 55
55 -
 56
56 -
 57
57 -
 58
58 -
 59
59 -
 60
60 -
 61
61 -
 62
62 -
 63
63 -
 64
64 -
 65
65 -
66
-
67
-
68
-
69
-
70
 |
 |

>> NOTES TO CONSOLIDATED FINANCIAL STATEMENTS (CONTINUED)
TYSON FOODS, INC. 2005 ANNUAL REPORT
>>>>>>>>>>>>>>>>
>>>>>>>>>>>>>>>>
Tyson Foods, Inc. >> 53
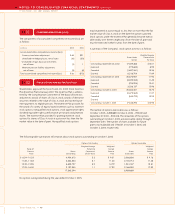
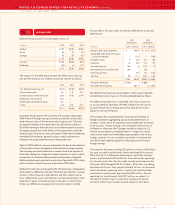
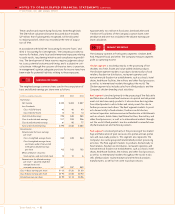
Prepared Foods segment includes the Company’s operations that
manufacture and market frozen and refrigerated food products.
Products include pepperoni, beef and pork pizza toppings, pizza
crusts, flour and corn tortilla products, appetizers, prepared
meals, ethnic foods, soups, sauces, side dishes, meat dishes and
processed meats. The Prepared Foods segment markets its products
domestically to food retailers, foodservice distributors, restaurant
operators and noncommercial foodservice establishments such as
schools, hotel chains, healthcare facilities, the military and other
food processors, as well as to international markets throughout
the world.
Other segment includes the logistics group and other corporate
activities not identified with specific protein groups. This segment
also includes proceeds of $167 million received in fiscal 2003
related to the settlement of vitamin antitrust litigation.
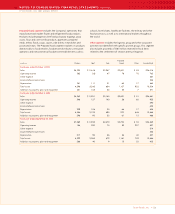
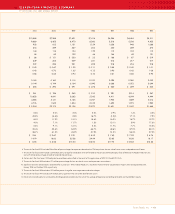
Prepared
in millions Chicken Beef Pork Foods Other Consolidated
Fiscal year ended October 1, 2005
Sales $8,295 $11,618 $3,247 $2,801 $ 53 $26,014
Operating income 582 (12) 47 78 70 765
Other expense 237
Income before income taxes 528
Depreciation 241 111 31 65 17 465
Total assets 4,398 3,243 834 1,107 922 10,504
Additions to property, plant and equipment 321 165 23 55 7 571
Fiscal year ended October 2, 2004
Sales $8,363 $11,951 $3,185 $2,891 $ 51 $26,441
Operating income 548 127 140 28 82 925
Other expense 290
Income before income taxes 635
Depreciation 239 106 30 66 17 458
Total assets 4,556 3,195 895 970 848 10,464
Additions to property, plant and equipment 298 90 22 61 15 486
Fiscal year ended September 27, 2003
Sales $7,389 $11,935 $2,470 $2,700 $ 55 $24,549
Operating income 156 320 75 59 227 837
Other expense 314
Income before income taxes 523
Depreciation 217 90 26 54 40 427
Total assets 4,322 3,385 879 1,141 759 10,486
Additions to property, plant and equipment 286 40 9 15 52 402