Tyson Foods 2005 Annual Report Download - page 25
Download and view the complete annual report
Please find page 25 of the 2005 Tyson Foods annual report below. You can navigate through the pages in the report by either clicking on the pages listed below, or by using the keyword search tool below to find specific information within the annual report.-
 1
1 -
2
-
3
-
4
-
5
-
6
-
7
-
8
-
9
-
10
-
11
-
12
-
13
-
14
-
 15
15 -
 16
16 -
 17
17 -
 18
18 -
 19
19 -
 20
20 -
 21
21 -
 22
22 -
 23
23 -
 24
24 -
 25
25 -
 26
26 -
 27
27 -
 28
28 -
 29
29 -
 30
30 -
 31
31 -
 32
32 -
 33
33 -
 34
34 -
 35
35 -
36
-
37
-
38
-
39
-
40
-
41
-
42
-
43
-
44
-
45
-
46
-
47
-
48
-
49
-
50
-
51
-
52
-
53
-
54
-
55
-
56
-
57
-
58
-
59
-
60
-
61
-
62
-
63
-
64
-
65
-
66
-
67
-
68
-
69
-
70
 |
 |

>> MANAGEMENT’S DISCUSSION AND ANALYSIS (CONTINUED)
TYSON FOODS, INC. 2005 ANNUAL REPORT
>>>>>>>>>>>>>>>>
>>>>>>>>>>>>>>>>
Tyson Foods, Inc. >> 23
decision to close its Manchester, New Hampshire, and Augusta,
Maine, Prepared Foods operations to further improve long-term
manufacturing efficiencies. After thorough analysis, the Company
determined the amount of capital required to bring the Manchester
and Augusta facilities to a competitive level and to maintain appro-
priate food safety standards, would be better spent to accommodate
production in newer more modern facilities. The majority of the
Manchester and Augusta production was consolidated into other
Company facilities. Fiscal 2003 costs were related to the closings
of the Company’s Berlin, Maryland, Stilwell, Oklahoma, and
Jacksonville, Florida, facilities. Also included in other charges for
fiscal 2004 were $25 million in charges related to the impairment of
various intangible assets and $21 million related to fixed asset write-
downs. The impairment charges apply primarily to trademarks
acquired in the acquisition of Tyson Fresh Meats, Inc. (TFM) in 2001.
These impairment charges primarily resulted from lower product
sales under some of the Company’s regional trademarks as prod-
ucts are increasingly being sold under the Tyson trademark. The fair
value of the Company’s trademarks is determined using a royalty
rate method based on expected revenues by trademark. The trade-
marks, as well as all other intangible assets, are reviewed at least
annually for impairment. The fixed asset write-downs were the
result of the Company implementing a control whereby all plant
facilities conduct fixed asset inventories on a recurring basis.
Interest expense decreased $21 million or 7.1%, primarily resulting
from an 8.2% decrease in the Company’s average indebtedness.
The Company incurred $13 million of expenses in each fiscal year
of 2004 and 2003, related to the buy back of bonds at attractive
prices when available in the market and to the early redemption
of Tyson de Mexico preferred shares. The overall weighted
average borrowing rate increased to 7.7% from 7.4%, primarily
due to the fiscal 2004 reduction of short-term debt, which
carried lower interest rates.
Other expense decreased $3 million as compared to fiscal 2003,
primarily resulting from the $10 million write-down related to
the impairment of an equity interest in a live swine operation
recorded in fiscal 2003. This decrease was partially offset by
increased foreign exchange losses of approximately $9 million
from the Company’s Canadian operation in fiscal 2004.
The effective tax rate increased from 35.5% in fiscal 2003 to 36.6%
in fiscal 2004. The estimated ETI amount reduced the fiscal 2004
effective tax rate by 0.5%, compared to 1.9% in fiscal 2003. The
decrease in the fiscal 2004 estimated ETI benefit resulted from a
reduction in the estimated fiscal 2004 profit from export sales
primarily due to the effects of BSE and avian influenza, along with
an adjustment to the estimated fiscal 2003 benefit. The fiscal 2004
estimated rate also increased due to the expiration of certain
general business credits.
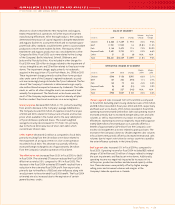
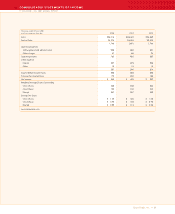
SALES BY SEGMENT
Volume Avg. Price
in millions 2004 2003 Change Change Change
Chicken $ 8,363 $ 7,389 $ 974 3.5% 9.4%
Beef 11,951 11,935 16 (9.8)% 11.0%
Pork 3,185 2,470 715 7.3% 20.2%
Prepared Foods 2,891 2,700 191 0.3% 6.8%
Other 51 55 (4) N/A N/A
Total $26,441 $24,549 $1,892 (1.5)% 9.4%
OPERATING INCOME BY SEGMENT
Margin Margin
in millions 2004 2003 Change 2004 2003
Chicken $548 $156 $392 6.6% 2.1%
Beef 127 320 (193) 1.1% 2.7%
Pork 140 75 65 4.4% 3.0%
Prepared Foods 28 59 (31) 1.0% 2.2%
Other 82 227 (145) N/A N/A
Total $925 $837 $ 88 3.5% 3.4%
Chicken segment sales increased 13.2% in fiscal 2004 as compared
to fiscal 2003. Excluding plant closing related accruals of $13 million
and $76 million recorded in fiscal years 2004 and 2003, respectively,
and fixed asset write-downs of $13 million recorded in fiscal 2004,
operating income increased $342 million. Sales and operating income
increased primarily due to increased average sales prices and sales
volumes, as well as improvements in product mix and operating
efficiencies. Operating income was negatively impacted by approxi-
mately $239 million of increased grain costs, partially offset by a
benefit of approximately $127 million from the Company’s com-
modity risk management activities related to grain purchases. The
increase in the Company’s domestic Chicken segment sales volumes
in fiscal 2004 were partially offset by decreased international sales
volumes due to import restrictions by various countries caused by
the avian influenza outbreaks in the United States.
Beef segment sales increased 0.1% in fiscal 2004 as compared to
fiscal 2003. Operating income for fiscal 2004 included BSE-related
charges of $61 million and $5 million of charges related to intangi-
ble asset impairments and fixed asset write-downs. Additionally,
operating income was negatively impacted by increases in live
cattle prices, production declines and decreased capacity utiliza-
tion. These decreases were partially offset by higher average
selling prices and increased volumes and margins at the
Company’s Lakeside operation in Canada.