Tyson Foods 2005 Annual Report Download - page 23
Download and view the complete annual report
Please find page 23 of the 2005 Tyson Foods annual report below. You can navigate through the pages in the report by either clicking on the pages listed below, or by using the keyword search tool below to find specific information within the annual report.-
 1
1 -
2
-
3
-
4
-
5
-
6
-
7
-
8
-
9
-
10
-
11
-
12
-
 13
13 -
 14
14 -
 15
15 -
 16
16 -
 17
17 -
 18
18 -
 19
19 -
 20
20 -
 21
21 -
 22
22 -
 23
23 -
 24
24 -
 25
25 -
 26
26 -
 27
27 -
 28
28 -
 29
29 -
 30
30 -
 31
31 -
 32
32 -
 33
33 -
34
-
35
-
36
-
37
-
38
-
39
-
40
-
41
-
42
-
43
-
44
-
45
-
46
-
47
-
48
-
49
-
50
-
51
-
52
-
53
-
54
-
55
-
56
-
57
-
58
-
59
-
60
-
61
-
62
-
63
-
64
-
65
-
66
-
67
-
68
-
69
-
70
 |
 |

>> MANAGEMENT’S DISCUSSION AND ANALYSIS (CONTINUED)
TYSON FOODS, INC. 2005 ANNUAL REPORT
>>>>>>>>>>>>>>>>
>>>>>>>>>>>>>>>>
Tyson Foods, Inc. >> 21
SEGMENT INFORMATION
Tyson operates in five business segments: Chicken, Beef, Pork,
Prepared Foods and Other. The Company measures segment profit
as operating income.
Chicken segment is involved primarily in the processing of live
chickens into fresh, frozen and value-added chicken products.
The Chicken segment markets its products domestically to
food retailers, foodservice distributors, restaurant operators
and noncommercial foodservice establishments such as schools,
hotel chains, healthcare facilities, the military and other food
processors, as well as to international markets throughout the
world. The Chicken segment also includes sales from allied prod-
ucts and the chicken breeding stock subsidiary.
Beef segment is involved primarily in the processing of live fed
cattle and fabrication of dressed beef carcasses into primal and
sub-primal meat cuts and case-ready products. It also involves
deriving value from allied products such as hides and variety meats
for sale to further processors and others. The Beef segment markets
its products domestically to food retailers, foodservice distributors,
restaurant operators and noncommercial foodservice establish-
ments such as schools, hotel chains, healthcare facilities, the
military and other food processors, as well as to international
markets throughout the world. Allied products are also marketed
to manufacturers of pharmaceuticals and technical products.
Pork segment is involved primarily in the processing of live market
hogs and fabrication of pork carcasses into primal and sub-primal
meat cuts and case-ready products. This segment also represents
the Company’s live swine group and related allied product process-
ing activities. The Pork segment markets its products domestically
to food retailers, foodservice distributors, restaurant operators and
noncommercial foodservice establishments such as schools, hotel
chains, healthcare facilities, the military and other food processors,
as well as to international markets throughout the world. It also
sells allied products to pharmaceutical and technical products
manufacturers, as well as live swine to pork producers.
Prepared Foods segment includes the Company’s operations
that manufacture and market frozen and refrigerated food prod-
ucts. Products include pepperoni, beef and pork pizza toppings,
pizza crusts, flour and corn tortilla products, appetizers, prepared
meals, ethnic foods, soups, sauces, side dishes and meat dishes,
and processed meats. The Prepared Foods segment markets its
products domestically to food retailers, foodservice distributors,
restaurant operators and noncommercial foodservice establish-
ments such as schools, hotel chains, healthcare facilities, the
military and other food processors, as well as to international
markets throughout the world.
Other segment includes the logistics group and other corporate
activities not identified with specific protein groups.
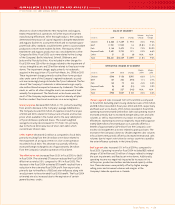
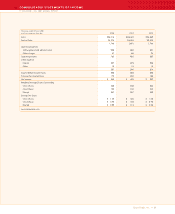
SALES BY SEGMENT
Volume Avg. Price
in millions 2005 2004 Change Change Change
Chicken $ 8,295 $ 8,363 $ (68) (2.6)% 1.8%
Beef 11,618 11,951 (333) (0.0)% (2.8)%
Pork 3,247 3,185 62 (4.6)% 6.9%
Prepared Foods 2,801 2,891 (90) (6.7)% 3.8%
Other 53 51 2 N/A N/A
Total $26,014 $26,441 $(427) (2.3)% 0.7%
OPERATING INCOME BY SEGMENT
Margin Margin
in millions 2005 2004 Change 2005 2004
Chicken $582 $548 $ 34 7.0% 6.6%
Beef (12) 127 (139) (0.1)% 1.1%
Pork 47 140 (93) 1.4% 4.4%
Prepared Foods 78 28 50 2.8% 1.0%
Other 70 82 (12) N/A N/A
Total $765 $925 $(160) 2.9% 3.5%
Chicken segment sales decreased 0.8% in fiscal 2005 as compared
to the same period last year. The decline in sales was primarily
due to lower volumes, caused largely by one less week of sales,
partially offset by higher average sales prices and improved prod-
uct mix. Chicken segment operating income increased $34 million
in fiscal 2005, as compared to the same period last year. Excluding
fiscal 2005 charges of $12 million related to plant closing accruals
and $8 million of hurricane losses, and fiscal 2004 charges of
$13 million related to fixed asset write-downs and $13 million
of plant closing related accruals, operating income increased
$28 million. Fiscal 2005 operating income was positively impacted
by decreased grain costs of $312 million. However, the current year
benefits from decreased grain costs were partially offset by the
effect of the Company realizing a loss of $27 million in fiscal 2005
as compared to a gain of $127 million in fiscal 2004 from the Company’s
commodity risk management activities. Additionally, fiscal 2005
operating income was negatively impacted by higher energy costs.