Tyson Foods 2005 Annual Report Download - page 54
Download and view the complete annual report
Please find page 54 of the 2005 Tyson Foods annual report below. You can navigate through the pages in the report by either clicking on the pages listed below, or by using the keyword search tool below to find specific information within the annual report.-
 1
1 -
2
-
3
-
4
-
5
-
6
-
7
-
8
-
9
-
10
-
11
-
12
-
13
-
14
-
15
-
16
-
17
-
18
-
19
-
20
-
21
-
22
-
23
-
24
-
25
-
26
-
27
-
28
-
29
-
30
-
31
-
32
-
33
-
34
-
35
-
36
-
37
-
38
-
39
-
40
-
41
-
42
-
43
-
 44
44 -
 45
45 -
 46
46 -
 47
47 -
 48
48 -
 49
49 -
 50
50 -
 51
51 -
 52
52 -
 53
53 -
 54
54 -
 55
55 -
 56
56 -
 57
57 -
 58
58 -
 59
59 -
 60
60 -
 61
61 -
 62
62 -
 63
63 -
 64
64 -
65
-
66
-
67
-
68
-
69
-
70
 |
 |

>> NOTES TO CONSOLIDATED FINANCIAL STATEMENTS (CONTINUED)
TYSON FOODS, INC. 2005 ANNUAL REPORT
Tyson Foods, Inc. >> 52
These carryforwards expire during fiscal years 2006 through 2023.
The $78 million valuation allowance discussed above includes
$27 million, that if subsequently recognized, will be allocated
to reduce goodwill, which was recorded at the time of acquisi-
tion of TFM.
In accordance with SFAS 109, “Accounting for Income Taxes,” and
SFAS 5, “Accounting for Contingencies,” the Company provides tax
reserves for federal, state, local and international exposures relating
to audit results, tax planning initiatives and compliance responsibil-
ities. The development of these reserves requires judgments about
tax issues, potential outcomes and timing, and is a subjective criti-
cal estimate. Although the outcome of these tax items is uncertain,
in management’s opinion, adequate provisions for income taxes have
been made for potential liabilities relating to these exposures.
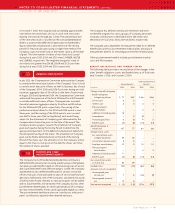
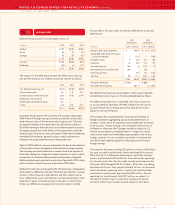
EARNINGS PER SHARE
>> 18
The weighted average common shares used in the computation of
basic and diluted earnings per share were as follows:
in millions, except per share data 2005 2004 2003
Numerator:
Net Income $ 353 $ 403 $ 337
Less Dividends:
Class A ($0.16/share) 40 40 40
Class B ($0.14/share) 15 15 14
Undistributed earnings 298 348 283
Class A undistributed earnings 217 253 206
Class B undistributed earnings 81 95 77
Total undistributed earnings $ 298 $ 348 $ 283
Denominator:
Denominator for basic earnings
per share:
Class A weighted average shares 243 243 244
Class B weighted average shares,
and shares under if-converted
method for diluted earnings
per share 102 102 102
Effect of dilutive securities:
Stock options and restricted stock 12 12 6
Denominator for diluted earnings
per share – adjusted weighted
average shares and
assumed conversions 357 357 352
Class A Basic earnings per share $1.05 $1.20 $1.00
Class B Basic earnings per share $0.95 $1.08 $0.90
Diluted earnings per share $0.99 $1.13 $0.96
Approximately two million in fiscal years 2005 and 2004, and
11 million in fiscal 2003, of the Company’s option shares were
antidilutive and were not included in the dilutive earnings per
share calculation.
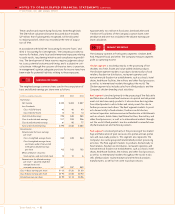
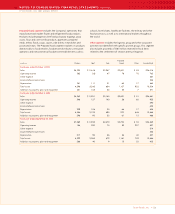
SEGMENT REPORTING
>> 19
The Company operates in five business segments: Chicken, Beef,
Pork, Prepared Foods and Other. The Company measures segment
profit as operating income.
Chicken segment is involved primarily in the processing of live
chickens into fresh, frozen and value-added chicken products.
The Chicken segment markets its products domestically to food
retailers, foodservice distributors, restaurant operators and
noncommercial foodservice establishments such as schools, hotel
chains, healthcare facilities, the military and other food processors,
as well as to international markets throughout the world. The
Chicken segment also includes sales from allied products and the
Company’s chicken breeding stock subsidiary.
Beef segment is involved primarily in the processing of live fed cattle
and fabrication of dressed beef carcasses into primal and sub-primal
meat cuts and case-ready products. It also involves deriving value
from allied products such as hides and variety meats for sale to
further processors and others. The Beef segment markets its prod-
ucts domestically to food retailers, foodservice distributors,
restaurant operators and noncommercial foodservice establishments
such as schools, hotel chains, healthcare facilities, the military and
other food processors, as well as to international markets through-
out the world. Allied products are also marketed to manufacturers
of pharmaceuticals and technical products.
Pork segment is involved primarily in the processing of live market
hogs and fabrication of pork carcasses into primal and sub-primal
cuts and case-ready products. This segment also represents the
Company’s live swine group and related allied product processing
activities. The Pork segment markets its products domestically to
food retailers, foodservice distributors, restaurant operators and
noncommercial foodservice establishments such as schools, hotel
chains, healthcare facilities, the military and other food processors,
as well as to international markets throughout the world. It also
sells allied products to pharmaceutical and technical products
manufacturers, as well as live swine to pork processors.