Tyson Foods 2005 Annual Report Download - page 36
Download and view the complete annual report
Please find page 36 of the 2005 Tyson Foods annual report below. You can navigate through the pages in the report by either clicking on the pages listed below, or by using the keyword search tool below to find specific information within the annual report.-
 1
1 -
2
-
3
-
4
-
5
-
6
-
7
-
8
-
9
-
10
-
11
-
12
-
13
-
14
-
15
-
16
-
17
-
18
-
19
-
20
-
21
-
22
-
23
-
24
-
25
-
 26
26 -
 27
27 -
 28
28 -
 29
29 -
 30
30 -
 31
31 -
 32
32 -
 33
33 -
 34
34 -
 35
35 -
 36
36 -
 37
37 -
 38
38 -
 39
39 -
 40
40 -
 41
41 -
 42
42 -
 43
43 -
 44
44 -
 45
45 -
 46
46 -
47
-
48
-
49
-
50
-
51
-
52
-
53
-
54
-
55
-
56
-
57
-
58
-
59
-
60
-
61
-
62
-
63
-
64
-
65
-
66
-
67
-
68
-
69
-
70
 |
 |

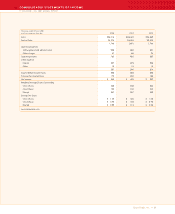
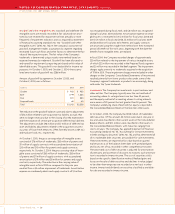
>> CONSOLIDATED STATEMENTS OF CASH FLOWS
TYSON FOODS, INC. 2005 ANNUAL REPORT
Tyson Foods, Inc. >> 34
Three years ended October 1, 2005
in millions 2005 2004 2003
Cash Flows From Operating Activities:
Net income $ 353 $ 403 $ 337
Adjustments to reconcile net income to cash provided by operating activities:
Depreciation 465 458 427
Amortization 36 32 31
Plant closing related charges 10 28 22
Impairment and write-down of assets 25 46 –
Deferred taxes (74) 8 113
Other (2) 4 36
(Increase) decrease in accounts receivable 24 67 (179)
(Increase) decrease in inventories 13 (65) (78)
Increase in trade accounts payable 11 109 60
Net change in other current assets and liabilities 138 (158) 51
Cash Provided by Operating Activities 999 932 820
Cash Flows From Investing Activities:
Additions to property, plant and equipment (571) (486) (402)
Proceeds from sale of assets 47 27 30
Purchases of marketable securities (543) (99) –
Proceeds from marketable securities 504––
Net change in other assets and liabilities 2 (42) 11
Cash Used for Investing Activities (561) (600) (361)
Cash Flows From Financing Activities:
Payments of debt, net (720) (242) (387)
Proceeds from borrowings of debt 353––
Purchase of treasury shares (45) (72) (41)
Dividends (55) (55) (54)
Stock options exercised and other 24 43 –
Cash Used for Financing Activities (443) (326) (482)
Effect of Exchange Rate Change on Cash 12 2 (3)
Increase (Decrease) in Cash and Cash Equivalents 7 8 (26)
Cash and Cash Equivalents at Beginning of Year 33 25 51
Cash and Cash Equivalents at End of Year $40 $33 $25
See accompanying notes.