Tyson Foods 2005 Annual Report Download - page 5
Download and view the complete annual report
Please find page 5 of the 2005 Tyson Foods annual report below. You can navigate through the pages in the report by either clicking on the pages listed below, or by using the keyword search tool below to find specific information within the annual report.-
 1
1 -
 2
2 -
 3
3 -
 4
4 -
 5
5 -
 6
6 -
 7
7 -
 8
8 -
 9
9 -
 10
10 -
 11
11 -
 12
12 -
 13
13 -
 14
14 -
 15
15 -
 16
16 -
17
-
18
-
19
-
20
-
21
-
22
-
23
-
24
-
25
-
26
-
27
-
28
-
29
-
30
-
31
-
32
-
33
-
34
-
35
-
36
-
37
-
38
-
39
-
40
-
41
-
42
-
43
-
44
-
45
-
46
-
47
-
48
-
49
-
50
-
51
-
52
-
53
-
54
-
55
-
56
-
57
-
58
-
59
-
60
-
61
-
62
-
63
-
64
-
65
-
66
-
67
-
68
-
69
-
70
 |
 |

Tyson Foods, Inc. >> 03
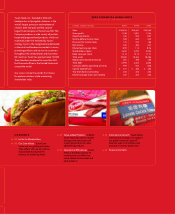
* Chicken market share is based on average weekly slaughter. Beef and pork market share is based on reported processing numbers.
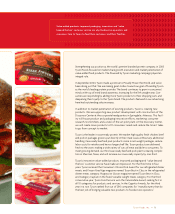
Tyson is the market leader in value-added frozen chicken
products. We still bring innovative products to this category,
which we created decades ago. We have an approximate
60 percent market share of bagged fully-cooked frozen
chicken and a 40 percent share for boxed products. Sales
volume in this category increased 26 percent in 2004 and
23 percent in 2005.
We are taking our knowledge in value-added chicken and
applying it to beef and pork. Value-added beef and pork prod-
ucts led to market share growth in both the foodservice and
consumer products distribution channels. Bacon sales were up
37 percent over the previous year. Tyson is now the number
two bacon marketer in the United States. Refrigerated dinner
meats sales were up 30 percent and refrigerated chicken and
steak strips sales were up 932 percent.
We increased distribution of case-ready beef and pork,
resulting in our fourth consecutive year of double-digit sales
growth. To meet growing demand, we are adding our third
case-ready facility, which is scheduled to begin production
in February 2006. When fully operational, it will increase
our capacity by one-third and allow us to serve our growing
case-ready customer base.
Along with new products, we add value for our customers
with service. In the past few years, we implemented an
account team approach, providing one face to the customer
for all three proteins. In the consumer products channel,
we have 14 teams in place to serve our largest retail and
club store accounts. In foodservice, we have 26 teams to
serve our largest chain restaurant accounts and broadline
distributors. Account teams increase our ability to deliver
our full portfolio of products and services to customers.
We support our customers’ growth through operations
planning. We dedicated four more plants to making
products exclusively for some of our largest customers.
We grow with customers to provide as much volume as
they need, when they need it.
Operational Efficiencies Striving to operate more effi-
ciently and maintain our best cost management practices
is the second part of our business strategy. Over the past
two years, we maintained or increased capacity and market
share while closing or consolidating seven plants. Our
on-going improvement programs make our processing
>>>>>>>>>>> >>>>>>
>>>>>>>>>>> >>>>>>
>>>>>>>>>>> >>>>>>
>>>>>>>>>>> >>>>>>
>>>>>>>>>>> >>>>>>
>>>>>>>>>>> >>>>>>
>>>>>>>>>>> >>>>>>
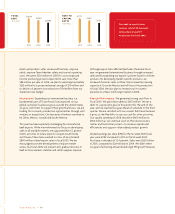
Canadian import issues
and export market
closings negatively
affected our earnings.
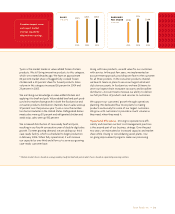
$24.5 $26.4 $26.0
SALES
IN BILLIONS
2003 2004 2005
$0.96
$1.13
$0.99
EARNINGS
PER SHARE
IN DOLLARS
2003 2004 2005