Tyson Foods 2005 Annual Report Download - page 50
Download and view the complete annual report
Please find page 50 of the 2005 Tyson Foods annual report below. You can navigate through the pages in the report by either clicking on the pages listed below, or by using the keyword search tool below to find specific information within the annual report.-
 1
1 -
2
-
3
-
4
-
5
-
6
-
7
-
8
-
9
-
10
-
11
-
12
-
13
-
14
-
15
-
16
-
17
-
18
-
19
-
20
-
21
-
22
-
23
-
24
-
25
-
26
-
27
-
28
-
29
-
30
-
31
-
32
-
33
-
34
-
35
-
36
-
37
-
38
-
39
-
 40
40 -
 41
41 -
 42
42 -
 43
43 -
 44
44 -
 45
45 -
 46
46 -
 47
47 -
 48
48 -
 49
49 -
 50
50 -
 51
51 -
 52
52 -
 53
53 -
 54
54 -
 55
55 -
 56
56 -
 57
57 -
 58
58 -
 59
59 -
 60
60 -
61
-
62
-
63
-
64
-
65
-
66
-
67
-
68
-
69
-
70
 |
 |

>> NOTES TO CONSOLIDATED FINANCIAL STATEMENTS (CONTINUED)
TYSON FOODS, INC. 2005 ANNUAL REPORT
Tyson Foods, Inc. >> 48
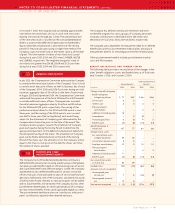
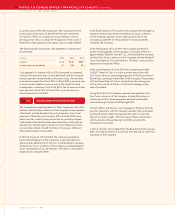
To determine the rate of return on assets assumption, the Company
first examined actual historical rates of return for the various asset
classes. The Company then determined a long-term projected rate
of return based on expected returns over the next five to 10 years.
Prior to fiscal 2004, the Company only had defined benefit plans
which provided a retirement benefit based on the number of years
of service multiplied by a benefit rate. During fiscal 2004, a plan
was added with a 4% compensation increase inherent in its benefit
obligation calculation.
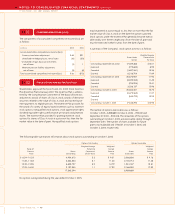
Amounts recognized in the Consolidated Balance Sheets consist of:
Other Postretirement
Pension Benefits Benefits
in millions 2005 2004 2005 2004
Prepaid benefit cost $7 $– $– $–
Accrued benefit liability (17) (10) (76) (75)
Accumulated other
comprehensive loss 76– –
Net amount recognized $ (3) $ (4) $(76) $(75)
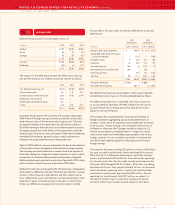
The increase (decrease) in the pretax liability related to the Company’s
pension plans included in other comprehensive income was
$1 million, $(2) million and $(6) million in fiscal years 2005, 2004
and 2003, respectively.
At October 1, 2005, two pension plans had an accumulated benefit
obligation in excess of plan assets, and two pension plans had assets
in excess of the accumulated benefit obligation. At October 2, 2004,
all pension plans had an accumulated benefit obligation in excess
of plan assets. The accumulated benefit obligation for all pension
plans was $98 million and $76 million at October 1, 2005, and
October 2, 2004, respectively. Plans with accumulated benefit
obligations in excess of plan assets are as follows:
Pension Benefits
in millions 2005 2004
Projected benefit obligation $37 $77
Accumulated benefit obligation 36 76
Fair value of plan assets 12 59
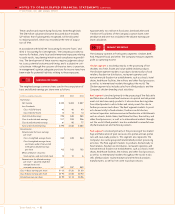
NET PERIODIC BENEFIT COST
Components of net periodic benefit cost for the Company’s pension and postretirement benefit plans recognized in the Consolidated
Statements of Income were as follows:
Pension Benefits Other Postretirement Benefits
in millions 2005 2004 2003 2005 2004 2003
Service cost $6 $3 $1 $ – $1 $ 1
Interest cost 654446
Expected return on plan assets (5) (5) (4) – – –
Amortization of prior service cost 11–(2)(1)–
Recognized actuarial (gain)/loss, net – – – 9 5 (13)
Net periodic benefit cost $8 $4 $1 $11 $9 $(6)
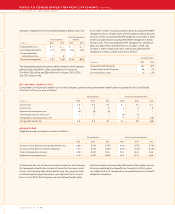
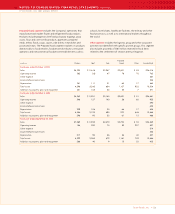
ASSUMPTIONS
Weighted average assumptions used are as follows:
Pension Benefits Other Postretirement Benefits
2005 2004 2003 2005 2004 2003
Discount rate to determine net periodic benefit cost 6.62% 6.75% 6.75% 6.00% 6.75% 6.75%
Discount rate to determine benefit obligations 5.91% 6.75% 6.75% 6.00% 6.75% 6.75%
Rate of compensation increase 4.00% 4.00% N/A N/A N/A N/A
Expected return on plan assets 8.13% 8.50% 8.50% N/A N/A N/A