Tyson Foods 2005 Annual Report Download - page 35
Download and view the complete annual report
Please find page 35 of the 2005 Tyson Foods annual report below. You can navigate through the pages in the report by either clicking on the pages listed below, or by using the keyword search tool below to find specific information within the annual report.-
 1
1 -
2
-
3
-
4
-
5
-
6
-
7
-
8
-
9
-
10
-
11
-
12
-
13
-
14
-
15
-
16
-
17
-
18
-
19
-
20
-
21
-
22
-
23
-
24
-
 25
25 -
 26
26 -
 27
27 -
 28
28 -
 29
29 -
 30
30 -
 31
31 -
 32
32 -
 33
33 -
 34
34 -
 35
35 -
 36
36 -
 37
37 -
 38
38 -
 39
39 -
 40
40 -
 41
41 -
 42
42 -
 43
43 -
 44
44 -
 45
45 -
46
-
47
-
48
-
49
-
50
-
51
-
52
-
53
-
54
-
55
-
56
-
57
-
58
-
59
-
60
-
61
-
62
-
63
-
64
-
65
-
66
-
67
-
68
-
69
-
70
 |
 |

>>
TYSON FOODS, INC. 2005 ANNUAL REPORT
>>>>>>>>>>>>>>>>
>>>>>>>>>>>>>>>>
Tyson Foods, Inc. >> 33
>>>>>>>>>>>>>>>>
>>>>>>>>>>>>>>>>
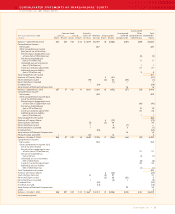
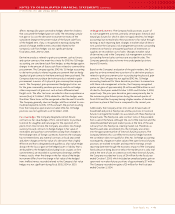
CONSOLIDATED STATEMENTS OF SHAREHOLDERS’ EQUITY
Accumulated
Common Stock Capital in Unamortized Other Total
Three years ended October 1, 2005 Class A Class B Excess of Retained Treasury Stock Deferred Comprehensive Shareholders’
in millions Shares Amount Shares Amount Par Value Earnings Shares Amount Compensation Income (Loss) Equity
Balance – September 28, 2002 267 $27 102 $10 $1,879 $2,097 16 $(265) $(37) $(49) $3,662
Comprehensive Income:
Net income 337 337
Other comprehensive income
(loss) net of tax of $8 million
Derivative gain recognized in cost
of sales (net of $(1) million tax) (2) (2)
Derivative unrealized gain
(net of $7 million tax) 11 11
Unrealized gain on investments
(net of $1 million tax) 11
Currency translation adjustment 21 21
Additional pension liability
(net of $2 million tax) 33
Total Comprehensive Income 371
Purchase of Treasury Shares 4 (41) (41)
Restricted Shares Issued (19) (4) 55 (37) (1)
Restricted Shares Canceled 1(1)1 1
Dividends Paid (54) (54)
Amortization of Deferred Compensation 16 16
Balance – September 27, 2003 267 27 102 10 1,861 2,380 16 (252) (57) (15) 3,954
Comprehensive Income:
Net income 403 403
Other comprehensive income (loss)
net of tax of $(13) million
Derivative gain recognized in cost
of sales (net of $(26) million tax) (40) (40)
Derivative unrealized gain
(net of $12 million tax) 19 19
Currency translation adjustment 23 23
Additional pension liability
(net of $1 million tax) 11
Total Comprehensive Income 406
Purchase of Treasury Shares 4 (72) (72)
Stock Options Exercised (2) (3) 44 42
Restricted Shares Issued 16(7) —
Restricted Shares Canceled 1 (4) 2 (1)
Dividends Paid (55) (55)
Amortization of Deferred Compensation 16 16
Reclassification and Other 1 (12) 14 2
Balance – October 2, 2004 268 27 102 10 1,849 2,728 17 (264) (46) (12) 4,292
Comprehensive Income:
Net income 353 353
Other comprehensive income (loss)
net of tax of $11 million
Derivative loss recognized in cost
of sales (net of $13 million tax) 21 21
Derivative unrealized loss
(net of $0 tax) (1) (1)
Unrealized loss on investments
(net of $(1) million) (2) (2)
Currency translation adjustment 23 23
Additional pension liability
(net of $(1) million tax) (1) (1)
Total Comprehensive Income 393
Purchase of Treasury Shares 3 (45) (45)
Stock Options Exercised 14 (3) 37 51
Restricted Shares Issued (2) 38 (35) 3
Restricted Shares Canceled 1 (4) 1 (2)
Dividends Paid (55) (55)
Dividends Accrued (13) (13)
Amortization of Deferred Compensation 25 25
Other 3 3
Balance – October 1, 2005 268 $27 102 $10 $1,867 $3,013 15 $(238) $(55) $ 28 $4,652
See accompanying notes.
>>