Tyson Foods 2005 Annual Report Download - page 56
Download and view the complete annual report
Please find page 56 of the 2005 Tyson Foods annual report below. You can navigate through the pages in the report by either clicking on the pages listed below, or by using the keyword search tool below to find specific information within the annual report.-
 1
1 -
2
-
3
-
4
-
5
-
6
-
7
-
8
-
9
-
10
-
11
-
12
-
13
-
14
-
15
-
16
-
17
-
18
-
19
-
20
-
21
-
22
-
23
-
24
-
25
-
26
-
27
-
28
-
29
-
30
-
31
-
32
-
33
-
34
-
35
-
36
-
37
-
38
-
39
-
40
-
41
-
42
-
43
-
44
-
45
-
 46
46 -
 47
47 -
 48
48 -
 49
49 -
 50
50 -
 51
51 -
 52
52 -
 53
53 -
 54
54 -
 55
55 -
 56
56 -
 57
57 -
 58
58 -
 59
59 -
 60
60 -
 61
61 -
 62
62 -
 63
63 -
 64
64 -
 65
65 -
 66
66 -
67
-
68
-
69
-
70
 |
 |

>> NOTES TO CONSOLIDATED FINANCIAL STATEMENTS (CONTINUED)
TYSON FOODS, INC. 2005 ANNUAL REPORT
Tyson Foods, Inc. >> 54
The Pork segment had sales of $505 million, $473 million and
$365 million for fiscal years 2005, 2004 and 2003, respectively,
from transactions with other operating segments of the Company.
The Beef segment had sales of $85 million, $75 million and
$77 million for fiscal years 2005, 2004 and 2003, respectively, from
transactions with other operating segments of the Company. The
aforementioned sales from intersegment transactions, which are
sold at market prices, were excluded from the segment sales in
the previous table.
The Company’s largest customer, Wal-Mart Stores, Inc., accounted
for approximately 13.0%, 11.6% and 9.6% of consolidated sales in
fiscal years 2005, 2004 and 2003, respectively. Sales to Wal-Mart
Stores, Inc. were included in the Chicken, Beef, Pork and Prepared
Foods segments. Any extended discontinuance of sales to this
customer could, if not replaced, have a material impact on the
Company’s operations; however, the Company does not anticipate
any such occurrences due to the demand for its products.
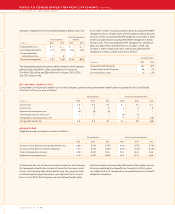
The majority of the Company’s operations are domiciled in the
United States. Approximately 94%, 94% and 95% of sales to external
customers for fiscal years 2005, 2004 and 2003, respectively, were
sourced from the United States. Approximately $6.3 billion of long-
lived assets were located in the United States at October 1, 2005,
$6.4 billion at October 2, 2004 and $6.5 billion at September 27, 2003.
Approximately $202 million, $171 million and $185 million of long-
lived assets were located in foreign countries, primarily Canada and
Mexico, at fiscal years ended 2005, 2004 and 2003, respectively.
The Company sells certain of its products in foreign markets,
primarily Canada, China, European Union, Japan, Mexico, Puerto
Rico, Russia, Taiwan and South Korea. The Company’s export sales
for fiscal years 2005, 2004 and 2003 totaled $2.1 billion, $2.1 billion
and $2.6 billion, respectively. Substantially all of the Company’s
export sales are facilitated through unaffiliated brokers, marketing
associations and foreign sales staffs. Foreign sales, which are sales
of products produced in a country other than the United States,
were less than 10% of total consolidated sales for fiscal years 2005,
2004 and 2003. Approximately 21%, 28% and 15% for 2005, 2004
and 2003, respectively, of income before taxes were from foreign
operations. The decrease in fiscal 2005 primarily was due to
decreased volumes and margins at the Company’s Lakeside
operation in Canada.
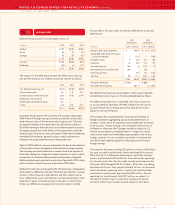
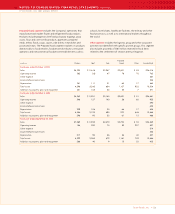
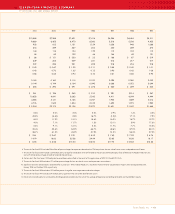
QUARTERLY FINANCIAL DATA (UNAUDITED)
>> 20
First Second Third Fourth
in millions, except per share data Quarter Quarter Quarter Quarter
2005
Sales $6,452 $6,359 $6,708 $6,495
Gross profit 363 422 526 429
Operating income 129 183 263 190
Net income 48 76 131 98
Class A basic earnings per share $ 0.14 $ 0.23 $ 0.39 $ 0.29
Class B basic earnings per share $ 0.13 $ 0.20 $ 0.35 $ 0.27
Diluted earnings per share $ 0.14 $ 0.21 $ 0.36 $ 0.28
2004
Sales $6,505 $6,153 $6,634 $7,149
Gross profit 394 485 550 462
Operating income 161 263 323 178
Net income 57 119 161 66
Class A basic earnings per share $ 0.17 $ 0.35 $ 0.48 $ 0.20
Class B basic earnings per share $ 0.15 $ 0.32 $ 0.43 $ 0.18
Diluted earnings per share $ 0.16 $ 0.33 $ 0.45 $ 0.19
The fourth quarter of 2004 was a 14-week period, while the remain-
ing quarters in the above table were 13-week periods.
First quarter fiscal 2005 gross profit included $12 million received in
connection with vitamin antitrust litigation, and operating income
included charges of $3 million related to the closing of a prepared
foods facility. Additionally, net income included a gain of $8 million
related to the sale of the Company’s remaining interest in Specialty
Brands, Inc. Second quarter fiscal 2005 operating income included
charges of $2 million related to the closings of poultry and pre-
pared foods facilities. Third quarter fiscal 2005 operating income
included charges of $33 million related to a legal settlement involv-
ing the Company’s live swine operations and $10 million related to
the closings of poultry operations. Fourth quarter fiscal 2005 gross
profit included $8 million related to hurricane losses and operating
income includes $1 million in gains related to plant closings.