TripAdvisor 2011 Annual Report Download - page 52
Download and view the complete annual report
Please find page 52 of the 2011 TripAdvisor annual report below. You can navigate through the pages in the report by either clicking on the pages listed below, or by using the keyword search tool below to find specific information within the annual report.-
 1
1 -
2
-
3
-
4
-
5
-
6
-
7
-
8
-
9
-
10
-
11
-
12
-
13
-
14
-
15
-
16
-
17
-
18
-
19
-
20
-
21
-
22
-
23
-
24
-
25
-
26
-
27
-
28
-
29
-
30
-
31
-
32
-
33
-
34
-
35
-
36
-
37
-
38
-
39
-
40
-
41
-
 42
42 -
 43
43 -
 44
44 -
 45
45 -
 46
46 -
 47
47 -
 48
48 -
 49
49 -
 50
50 -
 51
51 -
 52
52 -
 53
53 -
 54
54 -
 55
55 -
 56
56 -
 57
57 -
 58
58 -
 59
59 -
 60
60 -
 61
61 -
 62
62 -
63
-
64
-
65
-
66
-
67
-
68
-
69
-
70
-
71
-
72
-
73
-
74
-
75
-
76
-
77
-
78
-
79
-
80
-
81
-
82
-
83
-
84
-
85
-
86
-
87
-
88
-
89
-
90
-
91
-
92
-
93
-
94
-
95
-
96
-
97
-
98
-
99
-
100
-
101
-
102
-
103
-
104
-
105
-
106
-
107
-
108
-
109
-
110
-
111
-
112
-
113
-
114
-
115
-
116
-
117
-
118
-
119
-
120
-
121
-
122
-
123
-
124
-
125
 |
 |

Table of Contents
Historically, the cash we generate has been sufficient to fund our working capital and capital expenditure requirements. Subsequent to the
Spin-Off, management believes that our cash and cash equivalents, combined with expected cash flows generated by operating activities and the
new revolving credit facility, will be sufficient to fund our ongoing working capital needs, capital expenditure requirements and business growth
initiatives, meet our long term debt obligations and commitments, and fund acquisitions for at least the next 12 months.
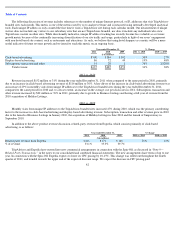
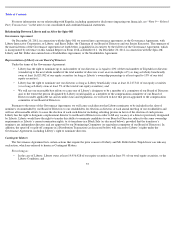
Our cash flows are as follows (in millions):
2011 vs. 2010
Operating Activities
For the year ended December 31, 2011, net cash provided by operating activities increased by $21 million or 11% when compared to the
same period in 2010, primarily due to higher operating income after adjusting for the impacts of depreciation and amortization, and cash inflows
from the Business Listing product, partially offset by an increase in income tax payments and the payment of a contingent purchase
consideration of which $3 million affected operating cash and working capital adjustments related to the Spin-Off.
Investing Activities
For the year ended December 31, 2011, net cash used in investing activities increased by $399 million or 286% when compared to the
same period in 2010 primarily due to a distribution of approximately $406 million paid to Expedia immediately prior to the Spin-Off, higher net
cash transfers to Expedia related to business operations between us and Expedia prior to Spin-Off of $30 million and, in October 2011, an
acquisition of a common control subsidiary in China from Expedia for $28 million, net of cash acquired, partially offset by a decrease of $27
million in cash paid for business acquisitions and a maturity of a short term investment of $20 million.
Financing Activities
For the year ended December 31, 2011, net cash provided by financing activities increased $408 million when compared to the same
period in 2010, primarily due to our term loan facility borrowing in conjunction with the Spin-Off of $400 million and additional short-term
borrowings of $16 million, consisting of $10 million from our new revolving credit facility related to the Spin-Off and an additional $6 million
related to our existing revolving credit facility in China. This was partially offset by a payment of a contingent purchase consideration of which
$10 million affected cash used in financing activities.
2010 vs. 2009
Operating Activities
For the year ended December 31, 2010, net cash provided by operating activities increased by $71 million, primarily due to higher
operating income after adjusting for the impacts of depreciation and amortization, and cash inflows from the Business Listing product, partially
offset by an increase in income tax payments.
48
Year ended December 31,
2011
2010
2009
Net cash provided by (used in):
Operating activities
$
218
$
197
$
126
Investing activities
$
(539
)
$
(140
)
$
(149
)
Financing activities
$
412
$
4
$
46