TripAdvisor 2011 Annual Report Download - page 46
Download and view the complete annual report
Please find page 46 of the 2011 TripAdvisor annual report below. You can navigate through the pages in the report by either clicking on the pages listed below, or by using the keyword search tool below to find specific information within the annual report.-
 1
1 -
2
-
3
-
4
-
5
-
6
-
7
-
8
-
9
-
10
-
11
-
12
-
13
-
14
-
15
-
16
-
17
-
18
-
19
-
20
-
21
-
22
-
23
-
24
-
25
-
26
-
27
-
28
-
29
-
30
-
31
-
32
-
33
-
34
-
35
-
 36
36 -
 37
37 -
 38
38 -
 39
39 -
 40
40 -
 41
41 -
 42
42 -
 43
43 -
 44
44 -
 45
45 -
 46
46 -
 47
47 -
 48
48 -
 49
49 -
 50
50 -
 51
51 -
 52
52 -
 53
53 -
 54
54 -
 55
55 -
 56
56 -
57
-
58
-
59
-
60
-
61
-
62
-
63
-
64
-
65
-
66
-
67
-
68
-
69
-
70
-
71
-
72
-
73
-
74
-
75
-
76
-
77
-
78
-
79
-
80
-
81
-
82
-
83
-
84
-
85
-
86
-
87
-
88
-
89
-
90
-
91
-
92
-
93
-
94
-
95
-
96
-
97
-
98
-
99
-
100
-
101
-
102
-
103
-
104
-
105
-
106
-
107
-
108
-
109
-
110
-
111
-
112
-
113
-
114
-
115
-
116
-
117
-
118
-
119
-
120
-
121
-
122
-
123
-
124
-
125
 |
 |

Table of Contents
The following discussion of revenue includes references to the number of unique Internet protocol, or IP, addresses that visit TripAdvisor-
branded sites each month. This metric is one of the metrics used by us to analyze revenue and is measured using internally developed analytical
tools. Each unique IP address is only counted the first time it visits a TripAdvisor site during each calendar month. Our measurement of unique
visitors does not include any visitors to our subsidiary sites that are not TripAdvisor-branded, nor does it include any individuals who view
TripAdvisor content on other sites. While directionally indicative, unique IP address tracking has recently become less valuable as a revenue
growth metric because of the continually increasing diversification of our site traffic and usage, particularly in light of our users’ engagement
with non-hotel based site content, such as restaurants and attractions. As such, we believe that using hotel shoppers as a metric will be a more
useful indicator of future revenue growth and we intend to track this metric on an ongoing basis.
2011 vs. 2010
Revenue increased $152 million or 31% during the year ended December 31, 2011 when compared to the same period in 2010, primarily
due to an increase in click-based advertising revenue of $116 million or 30%. A key driver of the increase in click-
based advertising revenue was
an increase of 29% in monthly visits from unique IP addresses to the TripAdvisor branded sites during the year ended December 31, 2011,
compared to the same period for 2010 and, to a lesser extent, an increase in the average cost per click rates in 2011. Subscription, transaction and
other revenue increased by $22 million or 76% in 2011, primarily due to growth in Business Listings and having a full year of revenue from the
2010 acquisition of Holiday Lettings.
2010 vs. 2009
Monthly visits from unique IP addresses to the TripAdvisor-branded sites increased 47% during 2010, which was the primary contributing
factor to the increase in click-based advertising and display-based advertising revenue. Subscription, transaction and other revenue grew in 2010
due to the launch of Business Listings in January 2010, the acquisition of Holiday Lettings in June 2010 and the launch of SniqueAway in
September 2010.
In addition to the above product revenue discussion, related-party revenue from Expedia, which consists primarily of click-based
advertising, is as follows:
TripAdvisor and Expedia have entered into new commercial arrangements in connection with the Spin-Off, as discussed in “Note 9—
Related Party Transactions
” in the notes to our consolidated and combined financial statements. The new arrangements have terms of up to one
year. In connection with the Spin
-Off, Expedia expects to lower its CPC pricing by 10-15%. This change was rolled out throughout the fourth
quarter of 2011, and trended towards the upper end of the expected discount range. We expect the decrease in CPC pricing paid
42
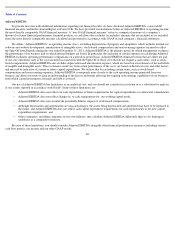
Year ended December 31,
% Change
2011
2010
2009
2011 vs. 2010
2010 vs. 2009
($ in millions)
Click
-
based advertising
$
500
$
384
$
302
30
%
27
%
Display
-
based advertising
86
72
49
19
%
48
%
Subscription, transaction and other
51
29
1
76
%
2,820
%
Total revenue
$
637
$
485
$
352
31
%
38
%
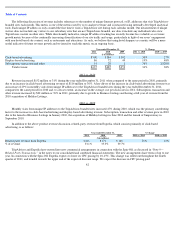
Year ended December 31,
% Change
2011
2010
2009
2011 vs. 2010
2010 vs. 2009
($ in millions)
Related party revenue from Expedia
$
211
$
171
$
140
23
%
22
%
% of revenue
33.1
%
35.3
%
39.7
%