TripAdvisor 2011 Annual Report Download - page 48
Download and view the complete annual report
Please find page 48 of the 2011 TripAdvisor annual report below. You can navigate through the pages in the report by either clicking on the pages listed below, or by using the keyword search tool below to find specific information within the annual report.-
 1
1 -
2
-
3
-
4
-
5
-
6
-
7
-
8
-
9
-
10
-
11
-
12
-
13
-
14
-
15
-
16
-
17
-
18
-
19
-
20
-
21
-
22
-
23
-
24
-
25
-
26
-
27
-
28
-
29
-
30
-
31
-
32
-
33
-
34
-
35
-
36
-
37
-
 38
38 -
 39
39 -
 40
40 -
 41
41 -
 42
42 -
 43
43 -
 44
44 -
 45
45 -
 46
46 -
 47
47 -
 48
48 -
 49
49 -
 50
50 -
 51
51 -
 52
52 -
 53
53 -
 54
54 -
 55
55 -
 56
56 -
 57
57 -
 58
58 -
59
-
60
-
61
-
62
-
63
-
64
-
65
-
66
-
67
-
68
-
69
-
70
-
71
-
72
-
73
-
74
-
75
-
76
-
77
-
78
-
79
-
80
-
81
-
82
-
83
-
84
-
85
-
86
-
87
-
88
-
89
-
90
-
91
-
92
-
93
-
94
-
95
-
96
-
97
-
98
-
99
-
100
-
101
-
102
-
103
-
104
-
105
-
106
-
107
-
108
-
109
-
110
-
111
-
112
-
113
-
114
-
115
-
116
-
117
-
118
-
119
-
120
-
121
-
122
-
123
-
124
-
125
 |
 |
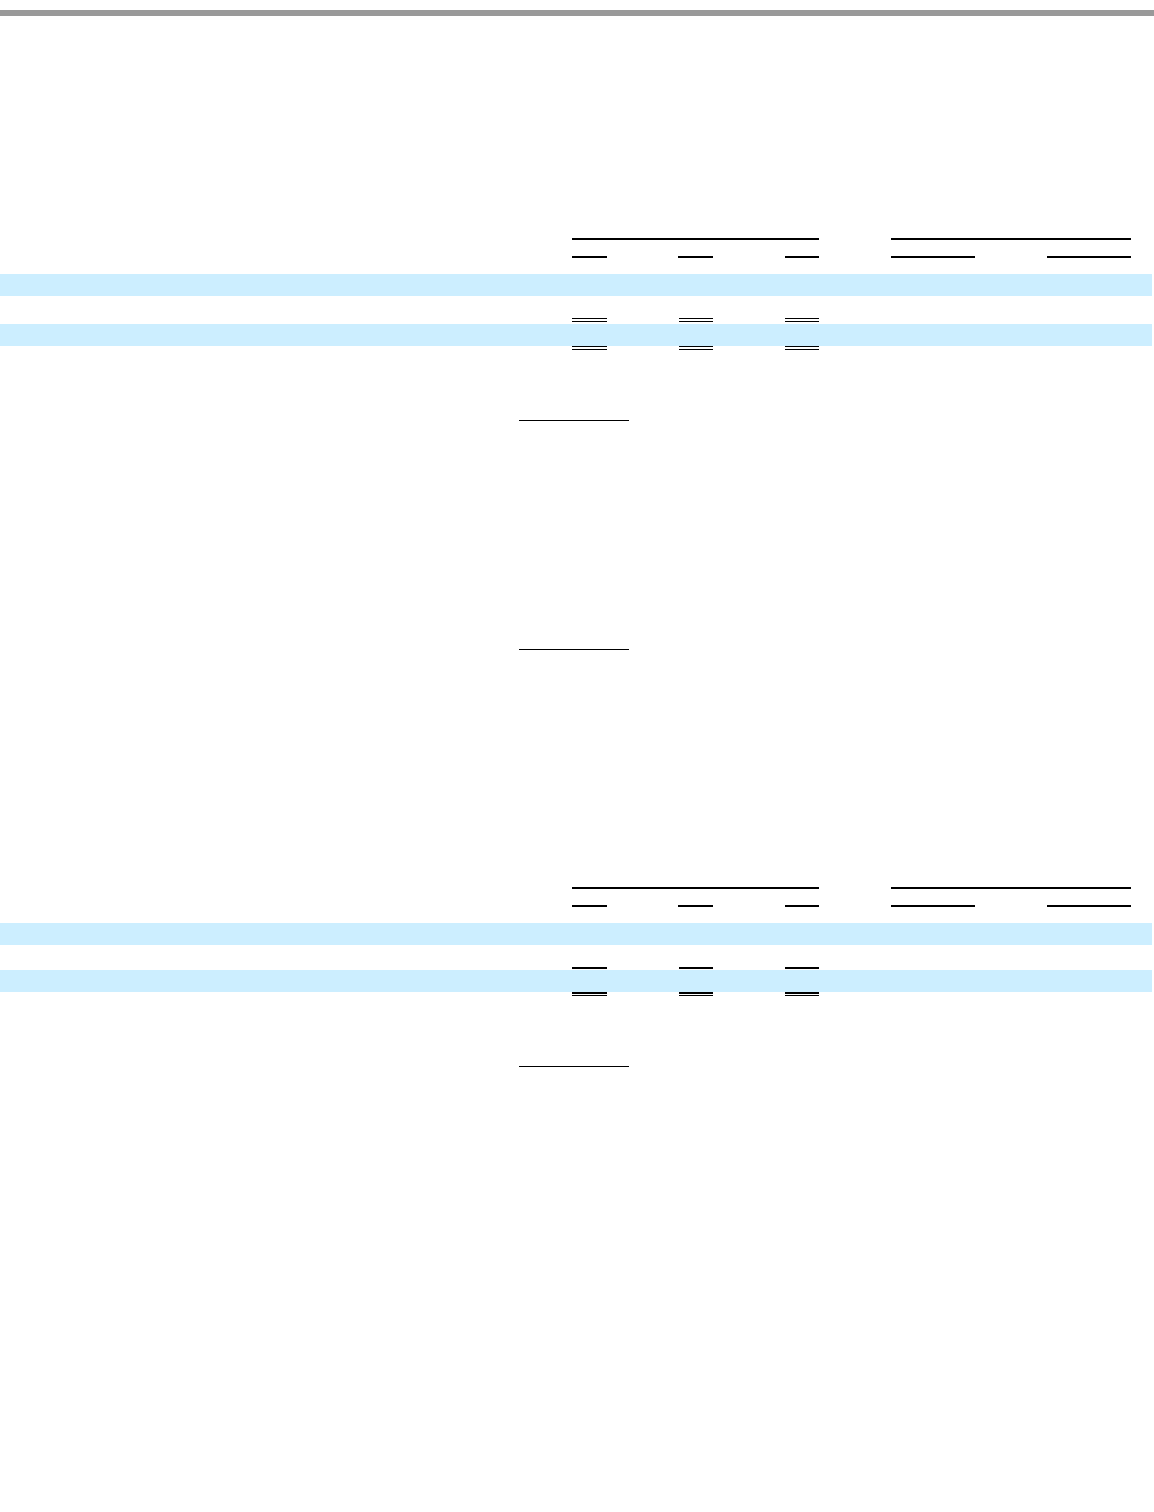
Table of Contents
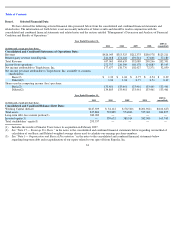
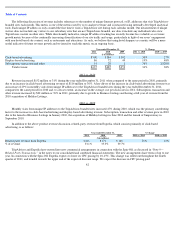
Technology and Content
Technology and content expenses consist of personnel and overhead expenses, including salaries and benefits, stock-based compensation
expense and bonuses for salaried employees and contractors engaged in the design, development, testing and maintenance of our website. Other
costs include licensing and maintenance expense.
2011 vs. 2010
Technology and content costs increased $14 million or 33% during the year ended December 31, 2011 when compared to the same period
in 2010, primarily due to increased personnel costs from increased headcount to support business expansion, including international site
launches, enhanced site features and mobile initiatives. Technology and content costs as a percent of revenue were 9% for 2011, consistent with
2010.
As discussed above, all depreciation costs of technology assets, including web servers and purchased and capitalized website and
development activities for all prior periods have been reclassified on this Annual Report on Form 10-K to depreciation expense on our
consolidated and combined statement of operations as of December 31, 2011.
2010 vs. 2009
The year-over-
year increase of $14 million in technology and content expense in 2010 was primarily due to increased personnel costs from
increased headcount to support business expansion, including site
launches in ten countries, enhanced site features and mobile initiatives, as well
as personnel added through acquisitions.
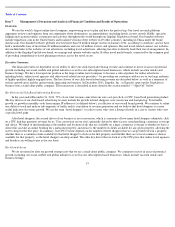
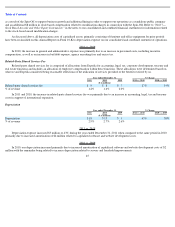
General and Administrative
General and administrative expense consists primarily of personnel and related overhead costs, including executive leadership, finance,
legal and human resource functions and stock-based compensation as well as professional service fees and other fees including audit, legal, tax
and accounting, and other costs including bad debt expense.
2011 vs. 2010
General and administrative costs increased $13 million or 41% during the year ended December 31, 2011, when compared to the same
period in 2010, primarily due to increased personnel costs from increased headcount
44
Year ended December 31,
% Change
2011
2010
2009
2011 vs. 2010
2010 vs. 2009
($ in millions)
Personnel and overhead
$
51
$
40
$
26
29
%
51
%
Other
6
3
3
74
%
16
%
Total technology and content
$
57
$
43
$
29
33
%
48
%
% of revenue
9.0
%
8.9
%
8.3
%
Year ended December 31,
% Change
2011
2010
2009
2011 vs. 2010
2010 vs. 2009
($ in millions)
Personnel and overhead
$
37
$
24
$
11
52
%
105
%
Professional service fees and other
8
8
3
5
%
203
%
Total general and administrative
$
45
$
32
$
14
41
%
123
%
% of revenue
7.0
%
6.6
%
4.1
%