TripAdvisor 2011 Annual Report Download - page 50
Download and view the complete annual report
Please find page 50 of the 2011 TripAdvisor annual report below. You can navigate through the pages in the report by either clicking on the pages listed below, or by using the keyword search tool below to find specific information within the annual report.-
 1
1 -
2
-
3
-
4
-
5
-
6
-
7
-
8
-
9
-
10
-
11
-
12
-
13
-
14
-
15
-
16
-
17
-
18
-
19
-
20
-
21
-
22
-
23
-
24
-
25
-
26
-
27
-
28
-
29
-
30
-
31
-
32
-
33
-
34
-
35
-
36
-
37
-
38
-
39
-
 40
40 -
 41
41 -
 42
42 -
 43
43 -
 44
44 -
 45
45 -
 46
46 -
 47
47 -
 48
48 -
 49
49 -
 50
50 -
 51
51 -
 52
52 -
 53
53 -
 54
54 -
 55
55 -
 56
56 -
 57
57 -
 58
58 -
 59
59 -
 60
60 -
61
-
62
-
63
-
64
-
65
-
66
-
67
-
68
-
69
-
70
-
71
-
72
-
73
-
74
-
75
-
76
-
77
-
78
-
79
-
80
-
81
-
82
-
83
-
84
-
85
-
86
-
87
-
88
-
89
-
90
-
91
-
92
-
93
-
94
-
95
-
96
-
97
-
98
-
99
-
100
-
101
-
102
-
103
-
104
-
105
-
106
-
107
-
108
-
109
-
110
-
111
-
112
-
113
-
114
-
115
-
116
-
117
-
118
-
119
-
120
-
121
-
122
-
123
-
124
-
125
 |
 |
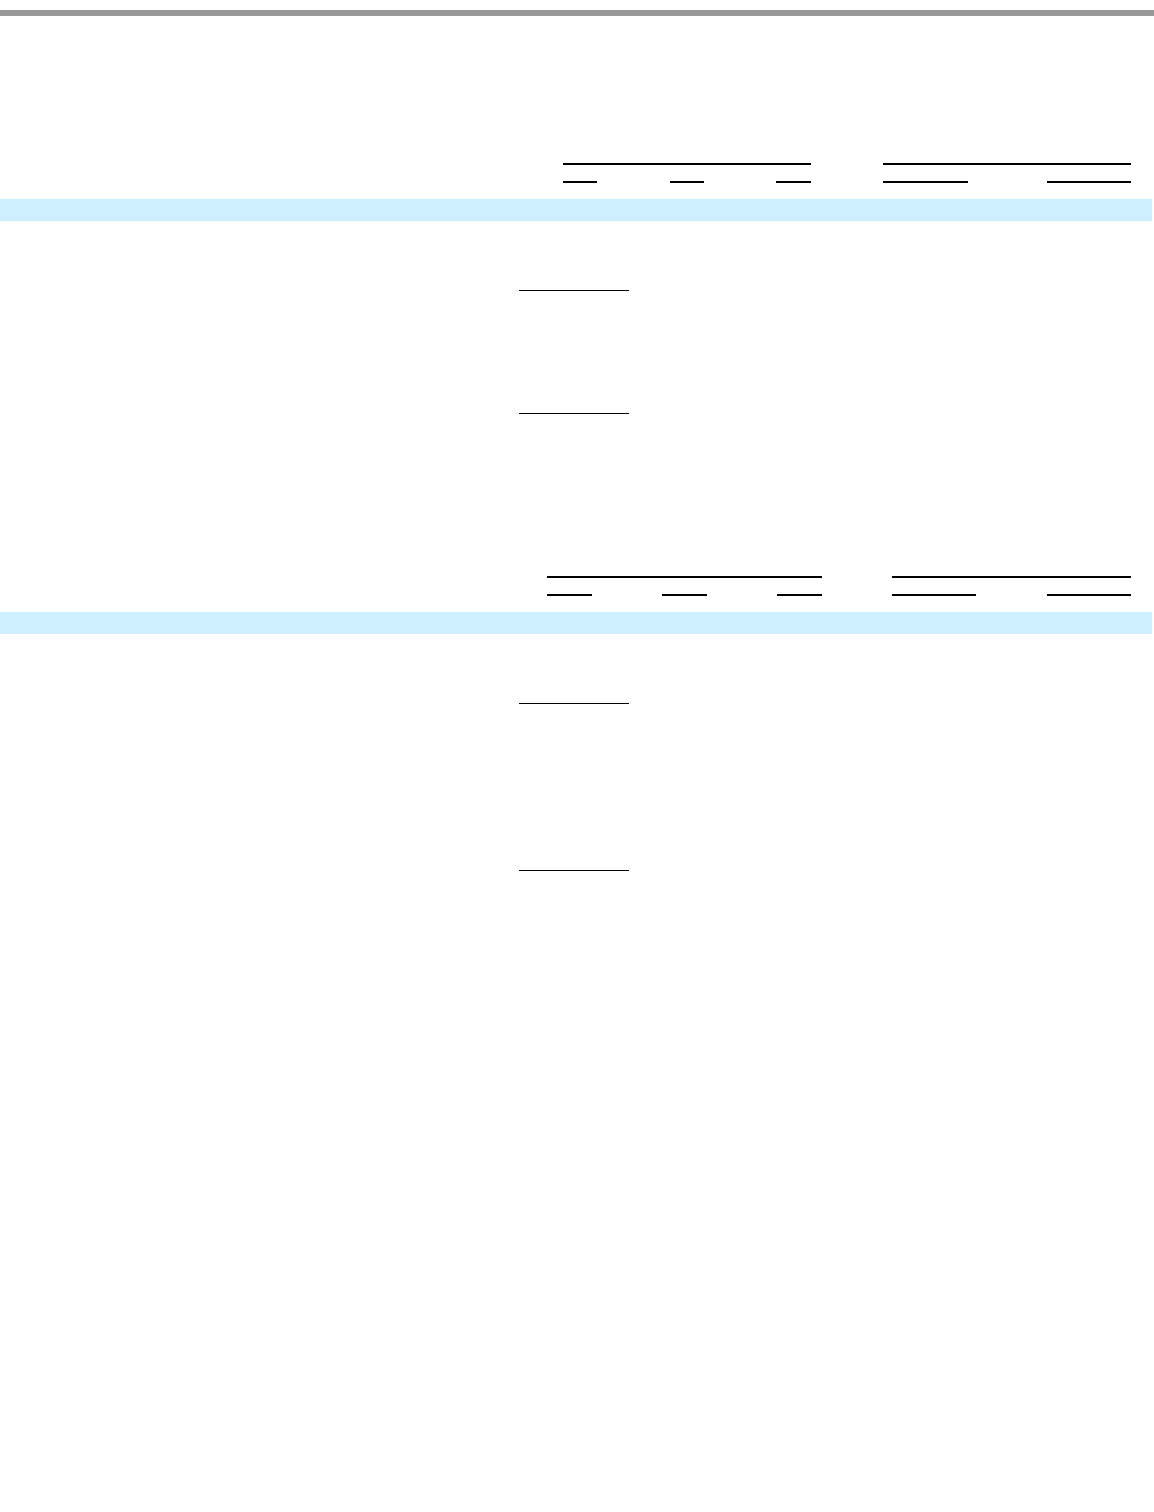
Table of Contents
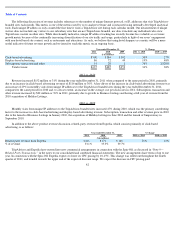
Amortization of Intangible Assets
2011 vs. 2010
Amortization of intangible assets decreased $7 million or 49% during the year ended December 31, 2011 when compared to the same
period in 2010, primarily due to the completion of amortization of $3 million related to certain technology intangible assets and a decrease in
amortization of $4 million related to the contingent purchase consideration for the acquisition of Holiday Lettings in June 2010.
2010 vs. 2009
In 2010, the increase in amortization of intangible assets expense was primarily due to a charge of approximately $4 million related to
changes in the estimated amount of contingent purchase consideration for the acquisition of Holiday Lettings in June 2010, partially offset by the
completion of amortization related to certain technology intangibles.
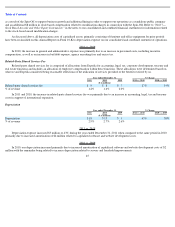
Operating Income
2011 vs. 2010
Operating income increased $47 million or 21% for the year ended December 31, 2011 when compared to the same period in 2010,
primarily due to an increase in revenue of $152 million or 31%, which was partially offset by a corresponding increase to operating expenses of
$106 million or 41%, particularly in personnel costs to support business growth and traffic acquisition costs to drive higher revenue. Also
included in total operating costs for the year ended December 31, 2011 is $7 million of costs incurred as part of the Spin-Off from Expedia,
which will be non-recurring for 2012.
2010 vs. 2009
In 2010, operating income increased primarily due to an increase in revenue, which was partially offset by a corresponding increase to
operating expenses, particularly in personnel costs to support business growth and traffic acquisition costs to drive higher revenue.
Related
-Party Interest Income (Expense), Net
Related-party interest income (expense), net is immaterial for all periods presented and is primarily intercompany in nature, arising from
the transfer of liquid funds between Expedia and us that occurred as part of Expedia’s treasury operations prior to the Spin-Off. This income
(expense) will be non-recurring for 2012.
46
Year ended December 31,
% Change
2011
2010
2009
2011 vs. 2010
2010 vs. 2009
($ in millions)
Amortization of intangible assets
$
8
$
15
$
14
(49
%)
6
%
% of revenue
1.2
%
3.0
%
3.9
%
Year ended December 31,
% Change
2011
2010
2009
2011 vs. 2010
2010 vs. 2009
($ in millions)
Operating income
$
273
$
226
$
168
21
%
35
%
% of revenue
42.8
%
46.7
%
47.8
%