TripAdvisor 2011 Annual Report Download - page 43
Download and view the complete annual report
Please find page 43 of the 2011 TripAdvisor annual report below. You can navigate through the pages in the report by either clicking on the pages listed below, or by using the keyword search tool below to find specific information within the annual report.-
 1
1 -
2
-
3
-
4
-
5
-
6
-
7
-
8
-
9
-
10
-
11
-
12
-
13
-
14
-
15
-
16
-
17
-
18
-
19
-
20
-
21
-
22
-
23
-
24
-
25
-
26
-
27
-
28
-
29
-
30
-
31
-
32
-
 33
33 -
 34
34 -
 35
35 -
 36
36 -
 37
37 -
 38
38 -
 39
39 -
 40
40 -
 41
41 -
 42
42 -
 43
43 -
 44
44 -
 45
45 -
 46
46 -
 47
47 -
 48
48 -
 49
49 -
 50
50 -
 51
51 -
 52
52 -
 53
53 -
54
-
55
-
56
-
57
-
58
-
59
-
60
-
61
-
62
-
63
-
64
-
65
-
66
-
67
-
68
-
69
-
70
-
71
-
72
-
73
-
74
-
75
-
76
-
77
-
78
-
79
-
80
-
81
-
82
-
83
-
84
-
85
-
86
-
87
-
88
-
89
-
90
-
91
-
92
-
93
-
94
-
95
-
96
-
97
-
98
-
99
-
100
-
101
-
102
-
103
-
104
-
105
-
106
-
107
-
108
-
109
-
110
-
111
-
112
-
113
-
114
-
115
-
116
-
117
-
118
-
119
-
120
-
121
-
122
-
123
-
124
-
125
 |
 |

Table of Contents
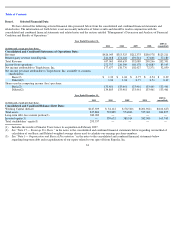
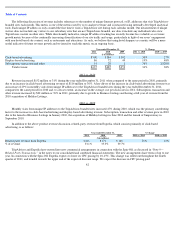
Results of Operations
Selected Financial Data
(in thousands, except per share data)
39
Year ended December 31,
% Change
2011
2010
2009
2011 vs. 2010
2010 vs. 2009
Revenue
$
426,045
$
313,525
$
212,375
36
%
48
%
Related
-
party revenue from Expedia
211,018
171,110
139,714
23
%
22
%
Total revenue
637,063
484,635
352,089
31
%
38
%
Costs and expenses:
Cost of revenue (exclusive of amortization) (1)
10,873
7,345
4,569
48
%
61
%
Selling and marketing(2)
209,176
140,470
105,679
49
%
33
%
Technology and content(2)
57,448
43,321
29,331
33
%
48
%
General and administrative(2)
44,770
31,819
14,286
41
%
123
%
Related
-
party shared services fee
9,222
7,900
6,910
17
%
14
%
Depreciation
18,362
12,871
9,330
43
%
38
%
Amortization of intangible assets
7,523
14,609
13,806
(49
%)
6
%
Spin
-
Off costs
6,932
—
—
100
%
—
Total costs and expenses
364,306
258,335
183,911
41
%
40
%
Operating income
272,757
226,300
168,178
21
%
35
%
Other income (expense):
Related
-
party interest income (expense), net
544
(241
)
(978
)
326
%
75
%
Other interest expense, net
(153
)
—
—
100
%
—
Other, net
(1,254
)
(1,644
)
(660
)
24
%
(149
%)
Total other expense, net
(863
)
(1,885
)
(1,638
)
54
%
(15
%)
Income before income taxes
271,894
224,415
166,540
21
%
35
%
Provision for income taxes
(94,103
)
(85,461
)
(64,325
)
10
%
33
%
Net income
177,791
138,954
102,215
28
%
36
%
Net (income) loss attributable to noncontrolling interest
(114
)
(178
)
212
(36
%)
184
%
Net income attributable to TripAdvisor, Inc.
$
177,677
$
138,776
$
102,427
28
%
35
%
Earnings Per Share attributable to TripAdvisor, Inc
:
Basic
$
1.33
$
1.04
$
0.77
28
%
35
%
Diluted
$
1.32
$
1.04
$
0.77
27
%
35
%
Weighted Average Common Shares Outstanding:
Basic
133,461
133,461
133,461
—
—
Diluted
134,865
133,461
133,461
1
%
—
Other Financial Data:
Adjusted EBITDA (3)
$
322,918
$
260,963
$
197,219
24
%
32
%
(1) Excludes amortization as follows:
Amortization of acquired technology included in
amortization of intangibles
$
578
$
1,080
$
4,356
Amortization of website development costs included in
depreciation
12,438
8,104
5,992
$
13,016
$
9,184
$
10,348
(2) Includes stock
-
based compensation as follows:
Selling and marketing
$
3,216
$
2,101
$
1,885
Technology and content
3,931
2,661
2,276
General and administrative
10,197
2,421
1,744
(3) See “Adjusted EBITDA” below for more information and for a reconciliation of Adjusted EBITDA to operating income, the most directly
comparable financial measure calculated and presented in accordance with U.S. generally accepted accounting principles, or GAAP.