TripAdvisor 2011 Annual Report Download - page 47
Download and view the complete annual report
Please find page 47 of the 2011 TripAdvisor annual report below. You can navigate through the pages in the report by either clicking on the pages listed below, or by using the keyword search tool below to find specific information within the annual report.-
 1
1 -
2
-
3
-
4
-
5
-
6
-
7
-
8
-
9
-
10
-
11
-
12
-
13
-
14
-
15
-
16
-
17
-
18
-
19
-
20
-
21
-
22
-
23
-
24
-
25
-
26
-
27
-
28
-
29
-
30
-
31
-
32
-
33
-
34
-
35
-
36
-
 37
37 -
 38
38 -
 39
39 -
 40
40 -
 41
41 -
 42
42 -
 43
43 -
 44
44 -
 45
45 -
 46
46 -
 47
47 -
 48
48 -
 49
49 -
 50
50 -
 51
51 -
 52
52 -
 53
53 -
 54
54 -
 55
55 -
 56
56 -
 57
57 -
58
-
59
-
60
-
61
-
62
-
63
-
64
-
65
-
66
-
67
-
68
-
69
-
70
-
71
-
72
-
73
-
74
-
75
-
76
-
77
-
78
-
79
-
80
-
81
-
82
-
83
-
84
-
85
-
86
-
87
-
88
-
89
-
90
-
91
-
92
-
93
-
94
-
95
-
96
-
97
-
98
-
99
-
100
-
101
-
102
-
103
-
104
-
105
-
106
-
107
-
108
-
109
-
110
-
111
-
112
-
113
-
114
-
115
-
116
-
117
-
118
-
119
-
120
-
121
-
122
-
123
-
124
-
125
 |
 |
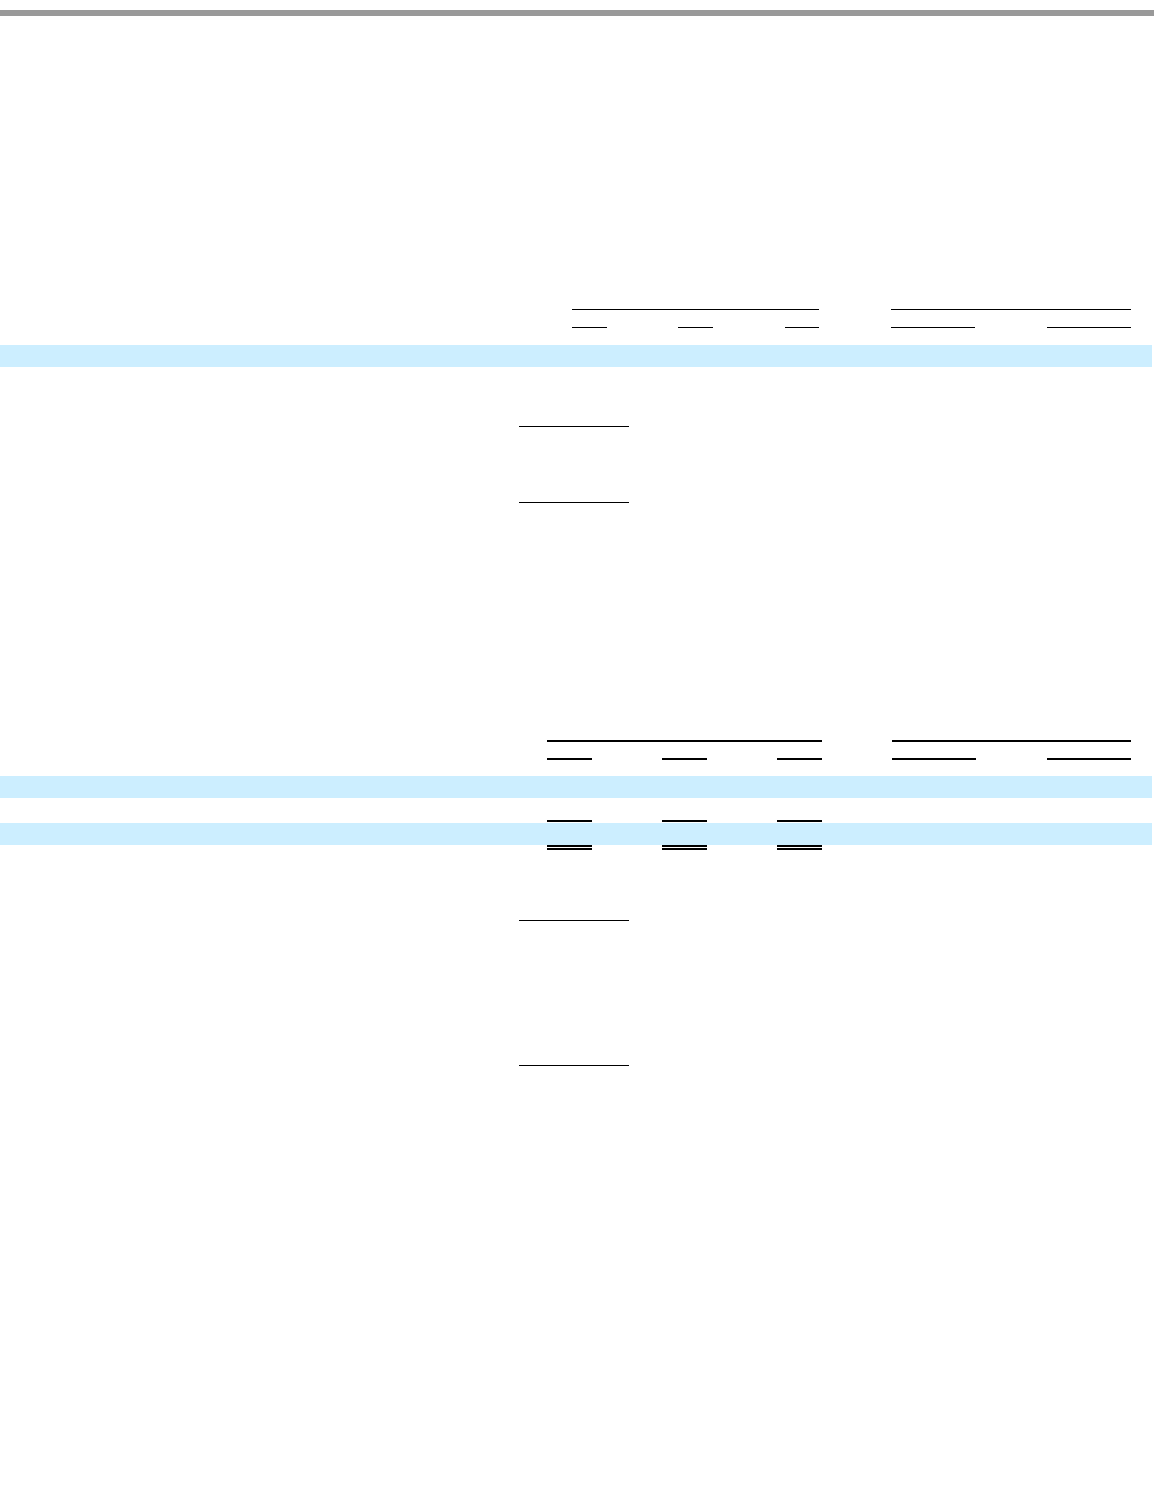
Table of Contents
by Expedia to continue to negatively impact total revenue for the year ending December 31, 2012 by approximately 5%. Some of this lost
revenue may be replaced by advertising revenue from other customers; however, we have not included this in our forward looking revenue
assumptions.
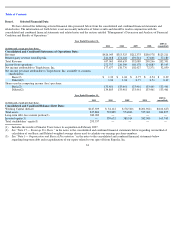
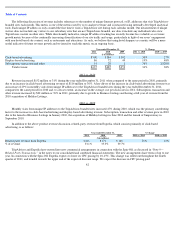
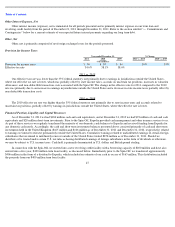
Cost of Revenue
Cost of revenue consists of expenses that are closely correlated or directly related to revenue generation, including advertisement fees,
flight search fees, credit card fees and data center costs.
2011 vs. 2010
Cost of revenue increased $4 million or 48% during the year ended December 31, 2011 when compared to the same period in 2010,
primarily due to increased data center costs in support of higher site traffic and increased credit card merchant fees.
2010 vs. 2009
In 2010, the primary drivers of the increase in cost of revenue expense were higher costs related to an increase in flight search volume and
data center costs in support of higher site traffic.
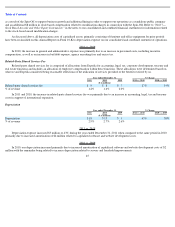
Selling and Marketing
Sales and marketing expenses primarily consist of direct costs, including search engine marketing, or SEM, other traffic acquisition costs,
syndication costs and affiliate program commissions, brand advertising and public relations. In addition, our indirect sales and marketing
expense consists of personnel and overhead expenses, including salaries, commissions, benefits, stock-based compensation expense and bonuses
for sales, sales support, customer support and marketing employees.
2011 vs. 2010
Direct selling and marketing costs increased $49 million or 57% during the year ended December 31, 2011when compared to the same
period in 2010, primarily due to increased SEM costs and other traffic acquisition costs. Personnel and overhead costs increased $20 million or
36% during the year ended December 31, 2011 when compared to the same period in 2010, primarily due to an increase in headcount to support
business growth, including international expansion.
2010 vs. 2009
The increase in total selling and marketing expense in 2010 was due to an increase in online and offline marketing expenses, including
SEM, other traffic acquisition costs, affiliate marketing expenses, and higher personnel costs primarily due to an increase in headcount, including
personnel added through acquisitions.
43
Year ended December 31,
% Change
2011
2010
2009
2011 vs. 2010
2010 vs. 2009
($ in millions)
Cost of revenue
$
11
$
7
$
5
48
%
61
%
% of revenue
1.7
%
1.5
%
1.3
%
Year ended December 31,
% Change
2011
2010
2009
2011 vs. 2010
2010 vs. 2009
($ in millions)
Direct costs
$
137
$
88
$
70
57
%
26
%
Personnel and overhead
72
52
$
36
36
%
47
%
Total selling and marketing
$
209
$
140
$
106
49
%
33
%
% of revenue
32.8
%
29.0
%
30.0
%