TripAdvisor 2011 Annual Report Download - page 45
Download and view the complete annual report
Please find page 45 of the 2011 TripAdvisor annual report below. You can navigate through the pages in the report by either clicking on the pages listed below, or by using the keyword search tool below to find specific information within the annual report.-
 1
1 -
2
-
3
-
4
-
5
-
6
-
7
-
8
-
9
-
10
-
11
-
12
-
13
-
14
-
15
-
16
-
17
-
18
-
19
-
20
-
21
-
22
-
23
-
24
-
25
-
26
-
27
-
28
-
29
-
30
-
31
-
32
-
33
-
34
-
 35
35 -
 36
36 -
 37
37 -
 38
38 -
 39
39 -
 40
40 -
 41
41 -
 42
42 -
 43
43 -
 44
44 -
 45
45 -
 46
46 -
 47
47 -
 48
48 -
 49
49 -
 50
50 -
 51
51 -
 52
52 -
 53
53 -
 54
54 -
 55
55 -
56
-
57
-
58
-
59
-
60
-
61
-
62
-
63
-
64
-
65
-
66
-
67
-
68
-
69
-
70
-
71
-
72
-
73
-
74
-
75
-
76
-
77
-
78
-
79
-
80
-
81
-
82
-
83
-
84
-
85
-
86
-
87
-
88
-
89
-
90
-
91
-
92
-
93
-
94
-
95
-
96
-
97
-
98
-
99
-
100
-
101
-
102
-
103
-
104
-
105
-
106
-
107
-
108
-
109
-
110
-
111
-
112
-
113
-
114
-
115
-
116
-
117
-
118
-
119
-
120
-
121
-
122
-
123
-
124
-
125
 |
 |

Table of Contents
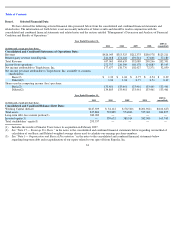
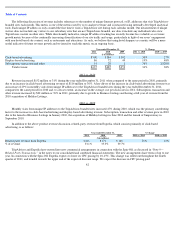
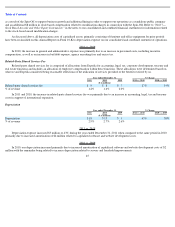
The following table is a reconciliation of Adjusted EBITDA to operating income for the periods presented:
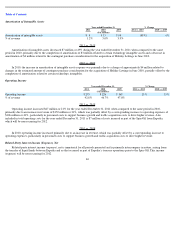
Reclassifications
Certain reclassifications have been made to conform the prior period’s data to the current format.
Our management has changed the non-GAAP financial measure that we use to measure our operating performance from OIBA to
Adjusted EBITDA. Consequently we have reclassified depreciation expense, which previously had resided in technology and content expense
and general and administrative expense, and have presented it as a separate line item on the consolidated and combined statement of operations.
This reclassification had no net effect on either total operating expenses or total operating income for any period. The table below provides a
reconciliation of that reclassification for the periods presented.
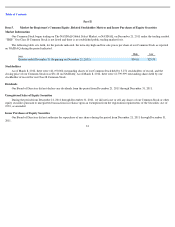
Revenue
We derive substantially all of our revenue through the sale of advertising, primarily through click-based advertising and, to a lesser extent,
display-based advertising. In addition, we earn revenue through a combination of subscription-based offerings, transaction revenue from our
flash sale website, SniqueAway, and other revenue including content licensing.
41
Year ended December 31,
(in thousands)
2011
2010
2009
Adjusted EBITDA
$
322,918
$
260,963
$
197,219
Depreciation (1)
(18,362
)
(12,871
)
(9,330
)
OIBA (2)
304,556
248,092
187,889
Amortization of intangible assets
(7,523
)
(14,609
)
(13,806
)
Stock
-
based compensation
(17,344
)
(7,183
)
(5,905
)
Spin
-
Off costs
(6,932
)
—
—
Operating income
272,757
226,300
168,178
(1)
Includes internal use software and website development costs.
(2) Our primary operating metric prior to the Spin-Off for evaluating operating performance was Operating Income Before Amortization, or
OIBA, as reported on our Form S-4, filed with the SEC on November 1, 2011. OIBA is defined as operating income plus: (1) amortization
of intangible assets and any related impairment; (2) stock-based compensation expense; and (3) non-recurring expenses incurred to effect
the Spin-Off during the year ended December 31, 2011. This operating metric is no longer being used by our management to measure
operating performance and is only being shown above to illustrate the financial impact as we convert to a new operating metric post Spin-
Off.
Year ended December 31,
(in thousands)
2010
2009
Depreciation (1)
$
12,871
$
9,330
Technology and content
(10,351
)
(7,743
)
General and administrative
(2,520
)
(1,587
)
$
—
$
—
(1) Reflects total depreciation expense as reported on our Form S-4, filed with the SEC on November 1, 2011 in our consolidated and
combined statement of cash flows.