TripAdvisor 2011 Annual Report Download - page 104
Download and view the complete annual report
Please find page 104 of the 2011 TripAdvisor annual report below. You can navigate through the pages in the report by either clicking on the pages listed below, or by using the keyword search tool below to find specific information within the annual report.-
 1
1 -
2
-
3
-
4
-
5
-
6
-
7
-
8
-
9
-
10
-
11
-
12
-
13
-
14
-
15
-
16
-
17
-
18
-
19
-
20
-
21
-
22
-
23
-
24
-
25
-
26
-
27
-
28
-
29
-
30
-
31
-
32
-
33
-
34
-
35
-
36
-
37
-
38
-
39
-
40
-
41
-
42
-
43
-
44
-
45
-
46
-
47
-
48
-
49
-
50
-
51
-
52
-
53
-
54
-
55
-
56
-
57
-
58
-
59
-
60
-
61
-
62
-
63
-
64
-
65
-
66
-
67
-
68
-
69
-
70
-
71
-
72
-
73
-
74
-
75
-
76
-
77
-
78
-
79
-
80
-
81
-
82
-
83
-
84
-
85
-
86
-
87
-
88
-
89
-
90
-
91
-
92
-
93
-
 94
94 -
 95
95 -
 96
96 -
 97
97 -
 98
98 -
 99
99 -
 100
100 -
 101
101 -
 102
102 -
 103
103 -
 104
104 -
 105
105 -
 106
106 -
 107
107 -
 108
108 -
 109
109 -
 110
110 -
 111
111 -
 112
112 -
 113
113 -
 114
114 -
115
-
116
-
117
-
118
-
119
-
120
-
121
-
122
-
123
-
124
-
125
 |
 |
Table of Contents
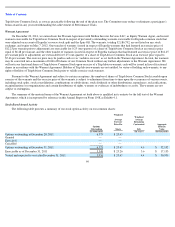
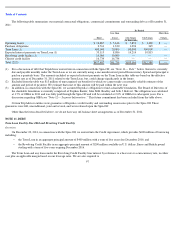
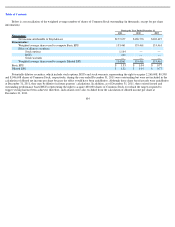
The following table is a reconciliation of Adjusted EBITDA to operating income and net income for the periods presented:
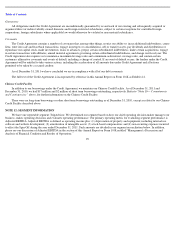
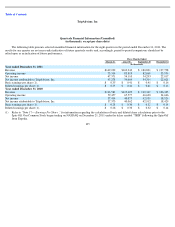
We derive substantially all of our revenue from the sale of advertising, primarily through click-based advertising and, to a lesser extent,
display-based advertising. The remainder of our revenue is generated through a combination of subscription-
based offerings, transaction revenue
from our flash sale website, SniqueAway, and other revenue including content licensing.
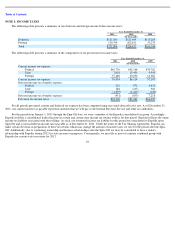
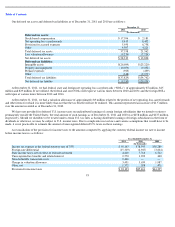
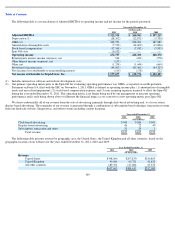
The following table presents revenue by geographic area, the United States, the United Kingdom and all other countries, based on the
geographic location of our websites for the years ended December 31, 2011, 2010 and 2009:
100
Year ended December 31,
(in thousands)
2011
2010
2009
Adjusted EBITDA
$
322,918
$
260,963
$
197,219
Depreciation (1)
(18,362
)
(12,871
)
(9,330
)
OIBA (2)
304,556
248,092
187,889
Amortization of intangible assets
(7,523
)
(14,609
)
(13,806
)
Stock
-
based compensation
(17,344
)
(7,183
)
(5,905
)
Spin
-
Off costs
(6,932
)
—
—
Operating income
272,757
226,300
168,178
Related
-
party interest income (expense), net
544
(241
)
(978
)
Other Interest income (expense), net
(153
)
—
—
Other, net
(1,254
)
(1,644
)
(660
)
Provision for income taxes
(94,103
)
(85,461
)
(64,325
)
Net (income) loss attributable to noncontrolling interest
(114
)
(178
)
212
Net income attributable to TripAdvisor, Inc
.
$
177,677
$
138,776
$
102,427
(1)
Includes internal use software and website development costs.
(2) Our primary operating metric prior to the Spin-Off for evaluating operating performance was OIBA, as reported on our Registration
Statement on Form S-
4, filed with the SEC on November 1, 2011. OIBA is defined as operating income plus: (1) amortization of intangible
assets and any related impairment; (2) stock-based compensation expense; and (3) non-recurring expenses incurred to effect the Spin-Off
during the year ended December 31, 2011. This operating metric is no longer being used by our management to measure operating
performance and is only being shown above to illustrate the financial impact as we convert to a new operating metric post Spin
-
Off.
Year ended December 31,
2011
2010
2009
($ in millions)
Click
-
based advertising
$
500
$
384
$
302
Display
-
based advertising
86
72
49
Subscription, transaction and other
51
29
1
Total revenue
$
637
$
485
$
352
Year Ended December 31,
2011
2010
2009
(In thousands)
Revenue
United States
$
348,066
$
297,830
$
246,865
United Kingdom
99,646
69,721
41,852
All other countries
189,351
117,084
63,372
$
637,063
$
484,635
$
352,089