TripAdvisor 2011 Annual Report Download - page 38
Download and view the complete annual report
Please find page 38 of the 2011 TripAdvisor annual report below. You can navigate through the pages in the report by either clicking on the pages listed below, or by using the keyword search tool below to find specific information within the annual report.-
 1
1 -
2
-
3
-
4
-
5
-
6
-
7
-
8
-
9
-
10
-
11
-
12
-
13
-
14
-
15
-
16
-
17
-
18
-
19
-
20
-
21
-
22
-
23
-
24
-
25
-
26
-
27
-
 28
28 -
 29
29 -
 30
30 -
 31
31 -
 32
32 -
 33
33 -
 34
34 -
 35
35 -
 36
36 -
 37
37 -
 38
38 -
 39
39 -
 40
40 -
 41
41 -
 42
42 -
 43
43 -
 44
44 -
 45
45 -
 46
46 -
 47
47 -
 48
48 -
49
-
50
-
51
-
52
-
53
-
54
-
55
-
56
-
57
-
58
-
59
-
60
-
61
-
62
-
63
-
64
-
65
-
66
-
67
-
68
-
69
-
70
-
71
-
72
-
73
-
74
-
75
-
76
-
77
-
78
-
79
-
80
-
81
-
82
-
83
-
84
-
85
-
86
-
87
-
88
-
89
-
90
-
91
-
92
-
93
-
94
-
95
-
96
-
97
-
98
-
99
-
100
-
101
-
102
-
103
-
104
-
105
-
106
-
107
-
108
-
109
-
110
-
111
-
112
-
113
-
114
-
115
-
116
-
117
-
118
-
119
-
120
-
121
-
122
-
123
-
124
-
125
 |
 |

Table of Contents
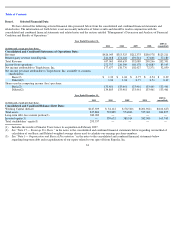
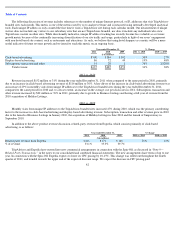
We have derived the following selected financial data presented below from the consolidated and combined financial statements and
related notes. The information set forth below is not necessarily indicative of future results and should be read in conjunction with the
consolidated and combined financial statements and related notes and the section entitled “Management’s Discussion and Analysis of Financial
Condition and Results of Operations.”
34
Item 6.
Selected Financial Data
Year Ended December 31,
2011
2010
2009
2008
2007(1)
(unaudited)
(in thousands, except per share data)
Consolidated and Combined Statements of Operations Data:
Revenue
$
426,045
$
313,525
$
212,375
$
200,578
$
125,211
Related
-
party revenue from Expedia
211,018
171,110
139,714
97,668
77,180
Total Revenue
637,063
484,635
352,089
298,246
202,391
Income from operations
272,757
226,300
168,178
124,883
85,165
Net income attributable to TripAdvisor, Inc.
177,677
138,776
102,427
72,371
52,050
Net income per share attributable to TripAdvisor, Inc. available to common
shareholders:
Basic(2)
$
1.33
$
1.04
$
0.77
$
0.54
$
0.39
Diluted(2)
1.32
1.04
0.77
0.54
0.39
Shares used in computing income (loss) per share:
Basic(2)
133,461
133,461
133,461
133,461
133,461
Diluted(2)
134,865
133,461
133,461
133,461
133,461
Year Ended December 31,
2011
2010
2009
2008
2007(1)
(unaudited)
(in thousands, except per share data)
Consolidated and Combined Balance Sheet Data:
Working Capital (deficit)
$
147,929
$
34,112
$
(78,560
)
$
(201,962
)
$
(166,627
)
Total assets
835,886
722,889
574,826
515,963
386,857
Long
-
term debt, less current portion(3)
380,000
—
—
—
—
Invested equity(3)
—
539,632
389,914
242,900
165,745
Total stockholders
’
equity(3)
293,537
—
—
—
—
(1)
Includes the results of Smarter Travel since its acquisition in February 2007.
(2) See “Note 17 — Earnings Per Share ” in the notes to the consolidated and combined financial statements below regarding our method of
calculation of our Basic and Diluted weighted average shares used to calculate our earnings per share numbers.
(3) See “Note 1— Organization and Basis of Presentation ” in the notes to the consolidated and combined financial statements below
regarding long
-
term debt and recapitalization of our equity related to our spin
-
off from Expedia, Inc.